FINAL Exam, Monday, May 4, 2020, 8 to 10
 Class
Introduction
Class
IntroductionSteven Chu
Georges Lemaitre (middle), Albert Einstein (right)
FINAL Exam, Monday, May 4, 2020, 8-10am
Lectures remaining, 18
OSU Calendar
ASA Abstract
 OCP, Freeman
Syllabus
CLASS Projects that have published
Carbon Cycles, SOIL 5813, 2018
Jeanie Borlaug Laube Women in Triticum (WIT) Early Career Award
Class Projects / Research Ideas


Nutrient Management for Agronomic Crops (Nebraska)
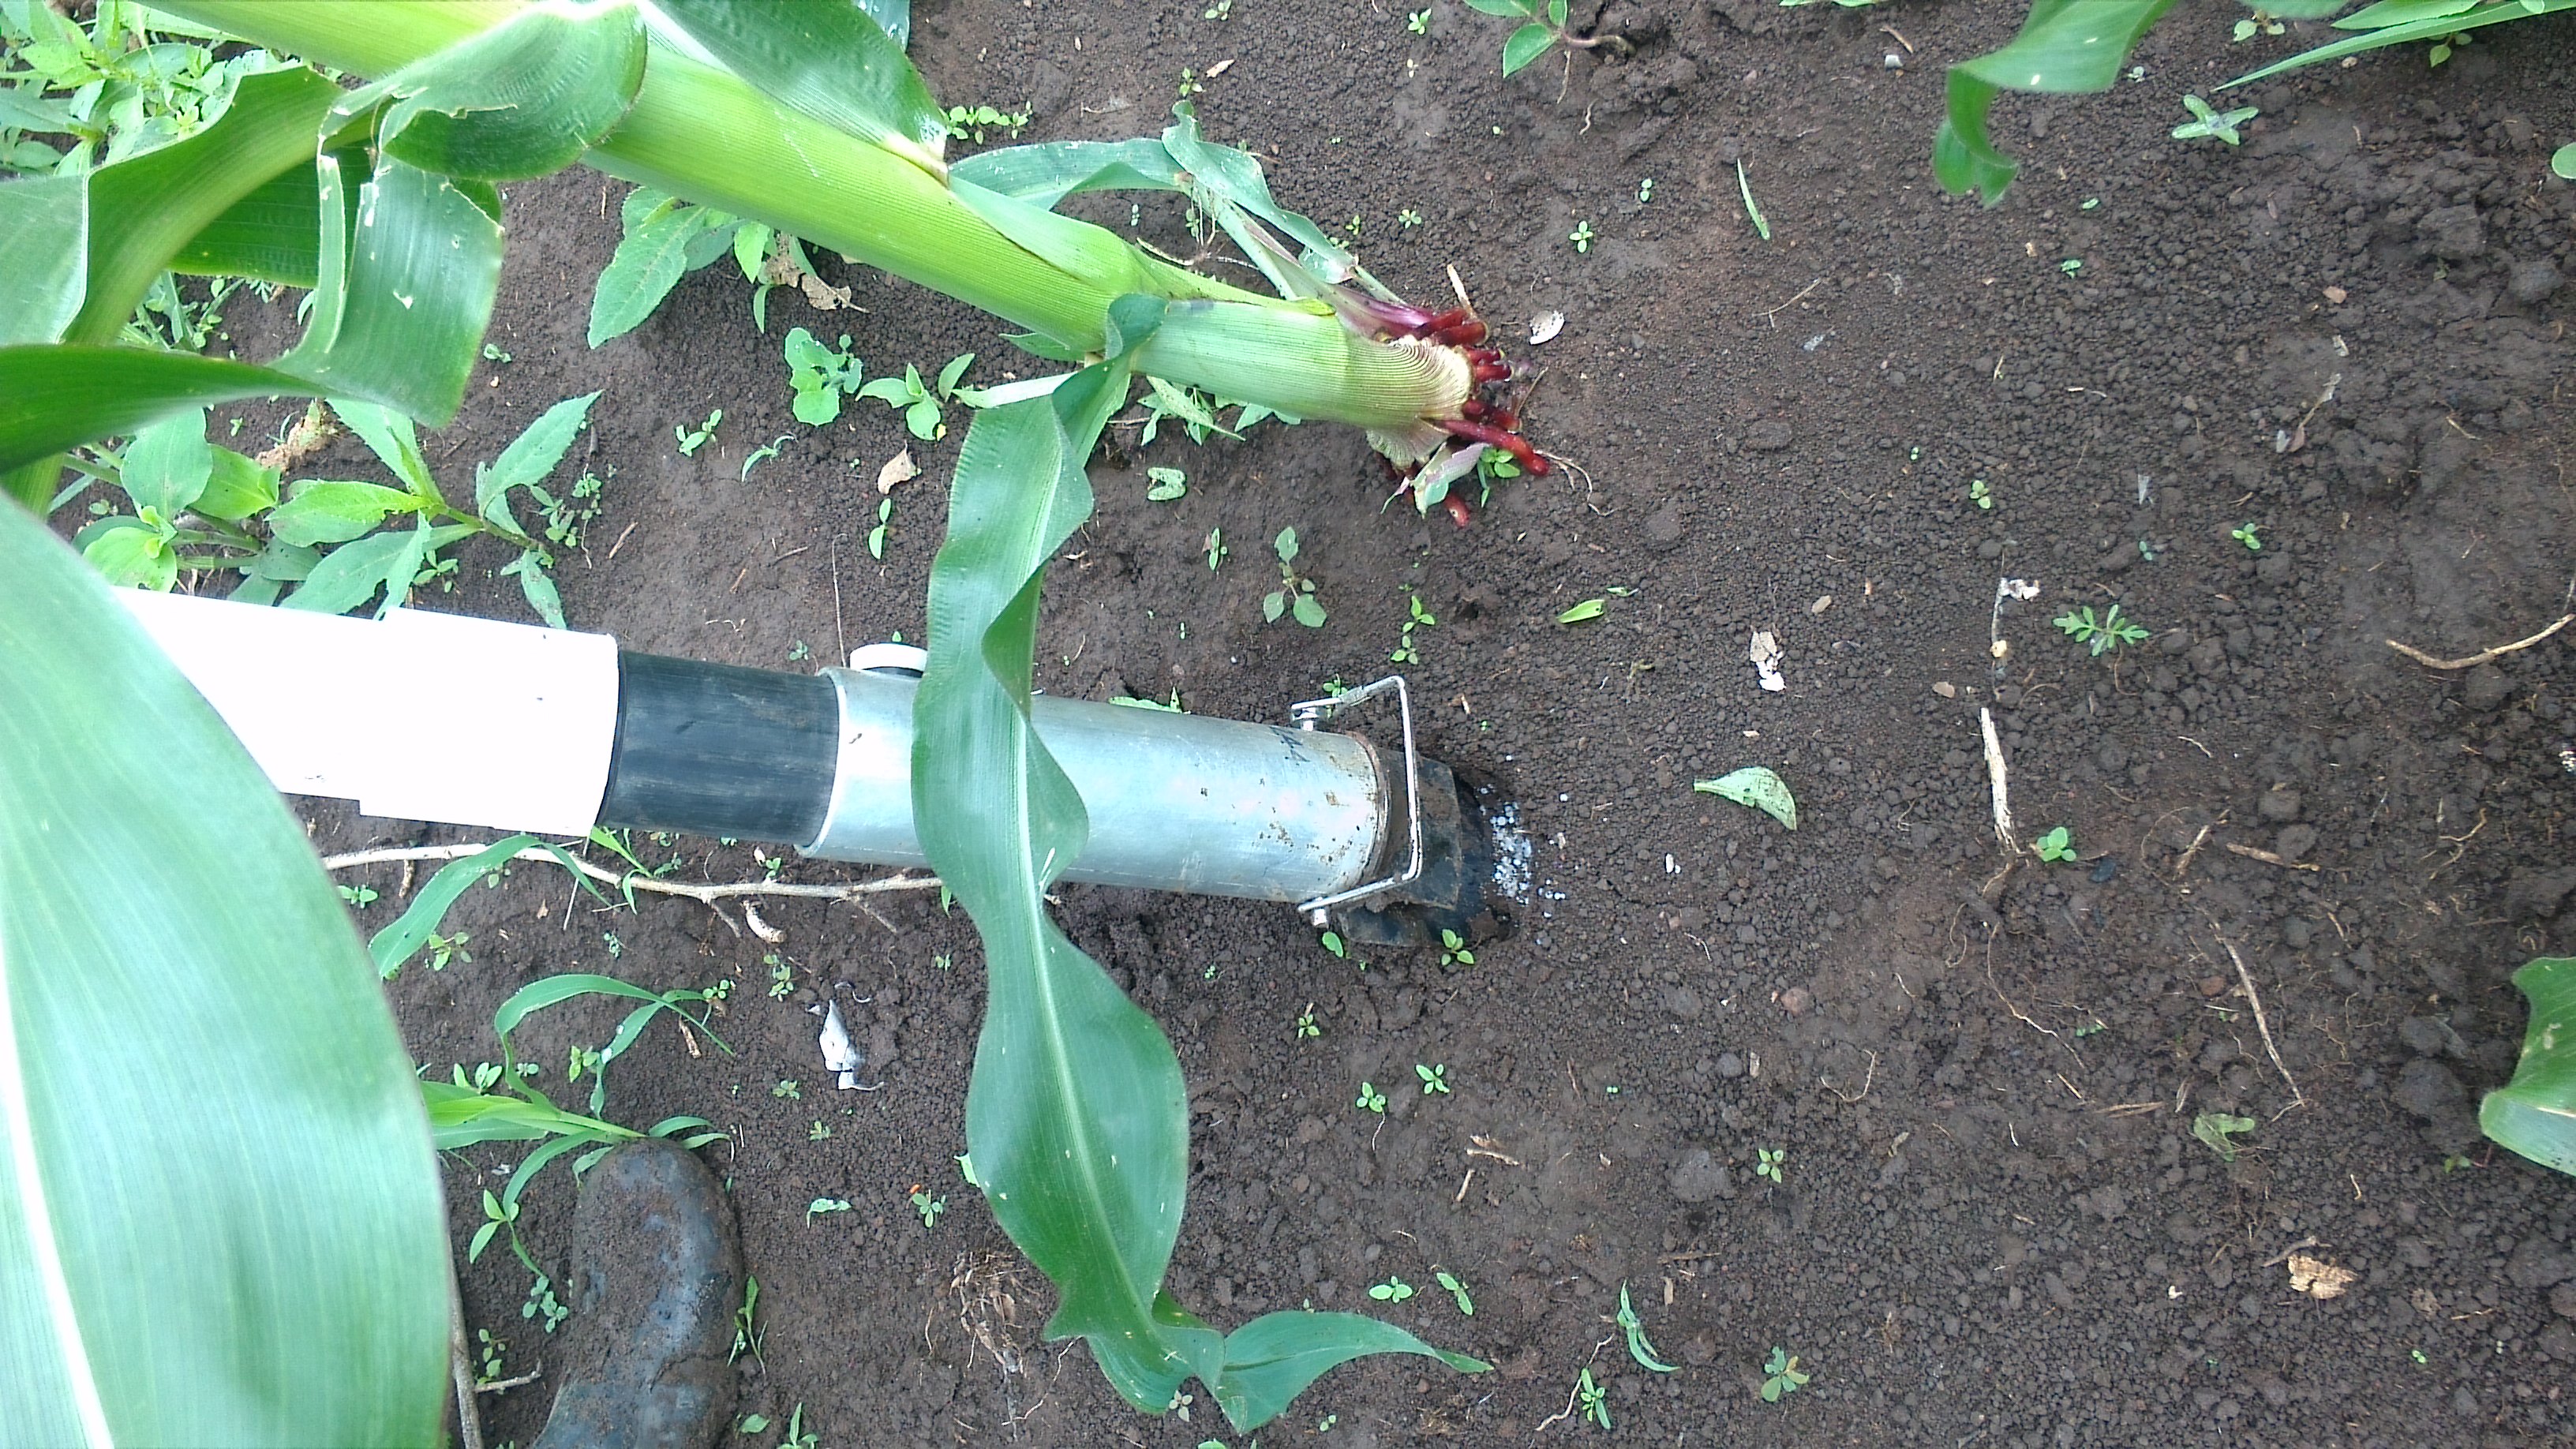
Hand Planter Project
BOOK, Update 2015
1.
Organic Carbon
(Ranney
Paper, OC conversion)
www.co2now.org
Nutrient Content of Crops, USDA
2.
History of Yield
Potential
(Can
Yield Goals be Predicted?) Published, Agronomy Journal
3. Nitrogen
new ISU N rate Calculator
4.
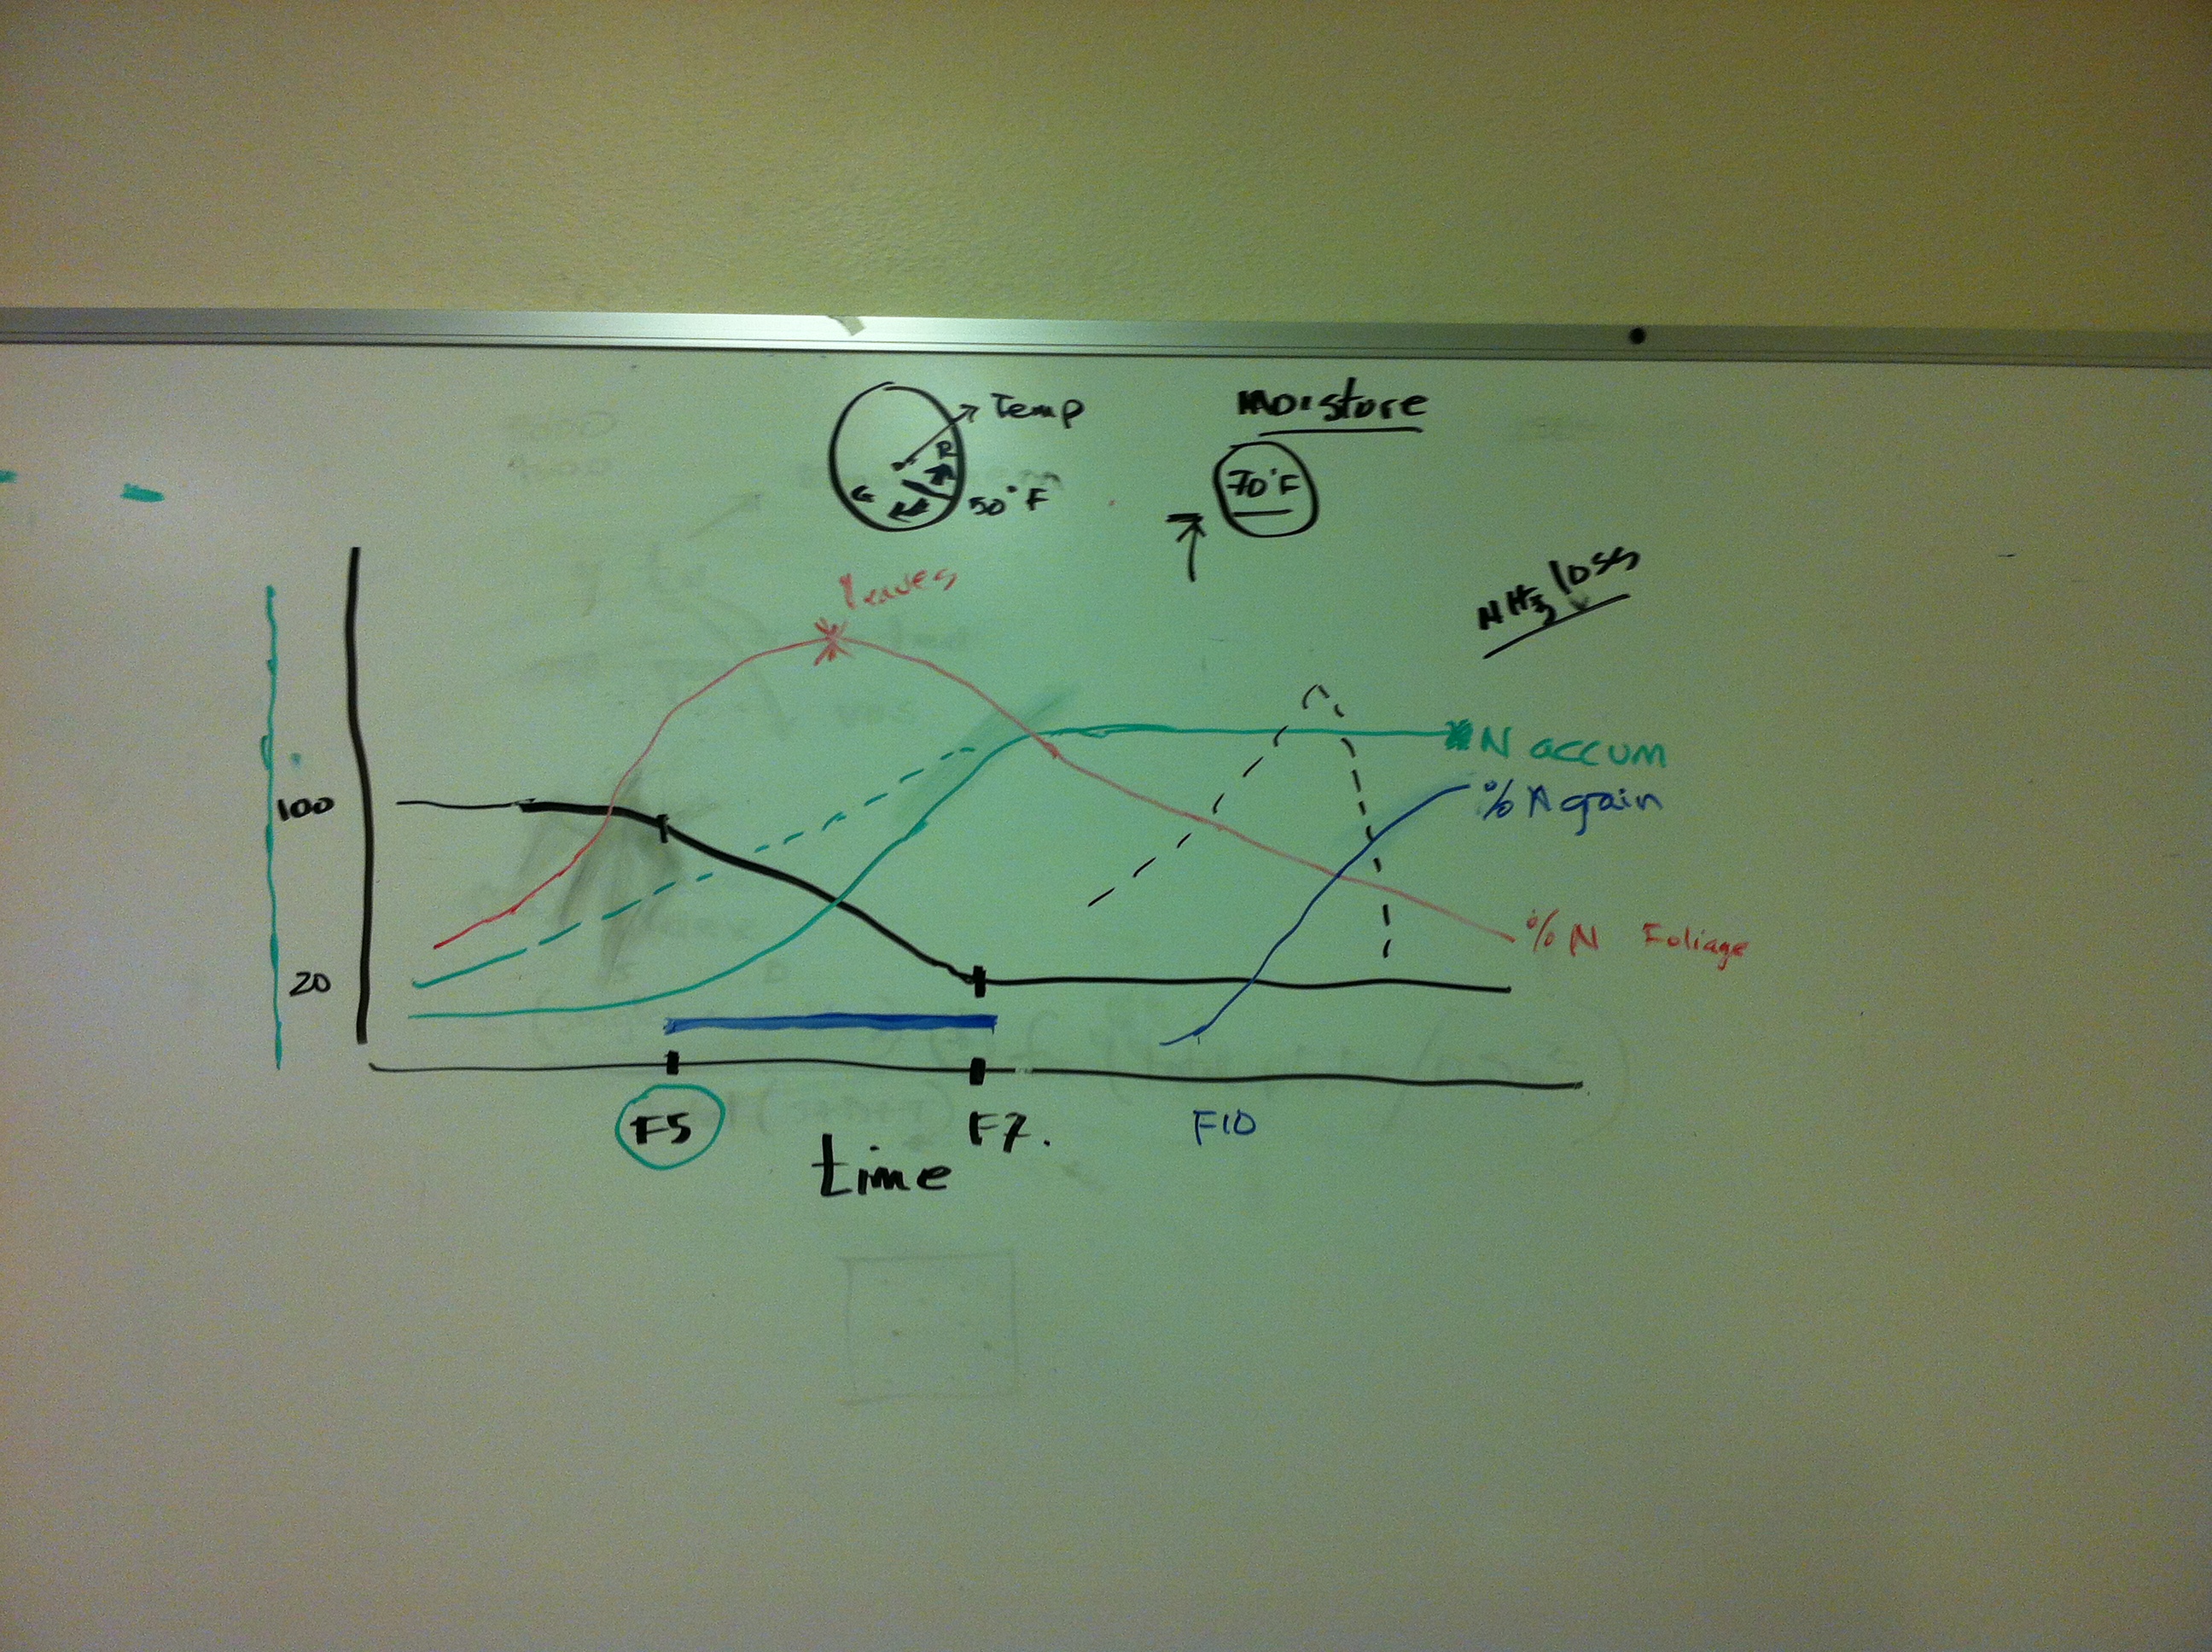
Nitrogen Accumulation
Page (NUE.okstate.edu,
Articles at the bottom)
5. Amino Sugar N test (J. Bushong)
Appendix 8:
Phosphorus Solubility
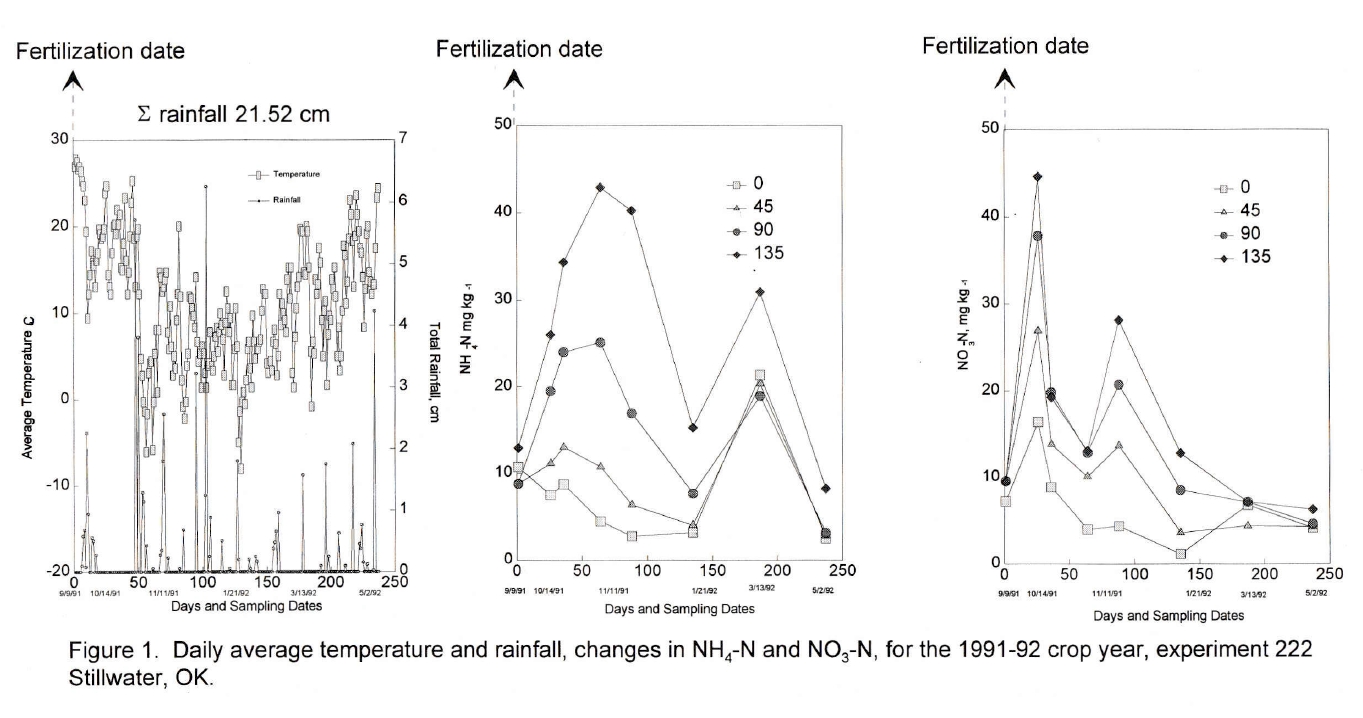
![]() (NO3-N, NH4-N with time)
(NO3-N, NH4-N with time)
 502, SBNRC, 100 pre
![]() 502 Yield Differences over time
502 Yield Differences over time
9. Nitrogen Fertilization Optimization Algorithm and the use of CV's
10. R.A. Olson, Soil Testing
(Commercial Labs versus University Labs)
a. Who is serving as the Judge?
b.
P Fertilization Limits (when does applied chicken litter become disposal
(P soil testing says we are 100% sufficient)

Steven Chu
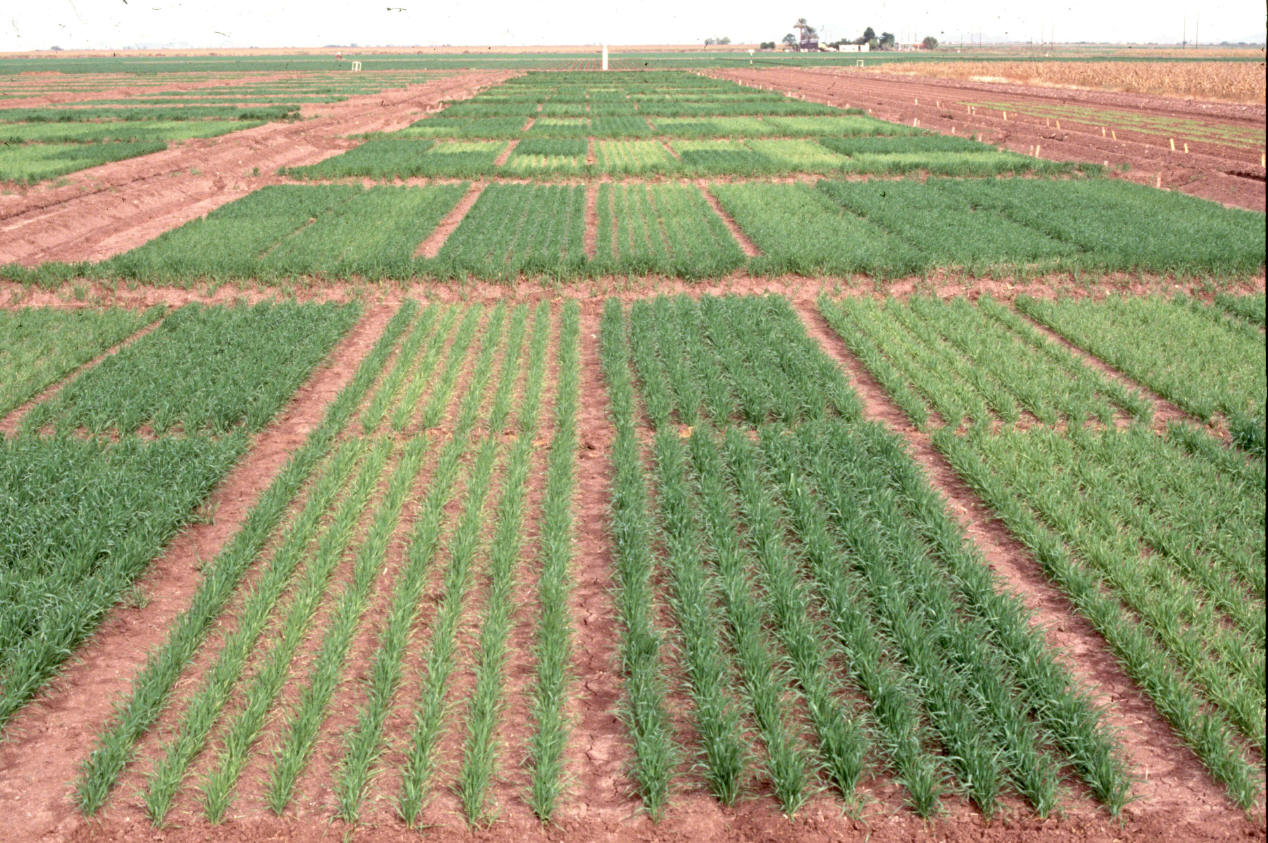
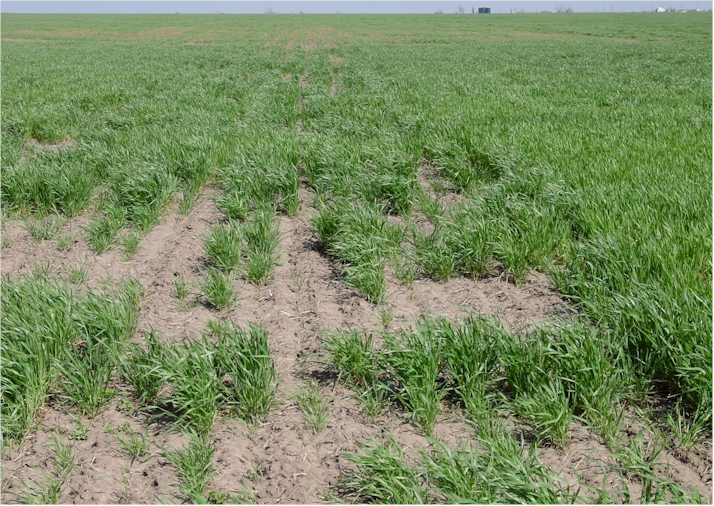
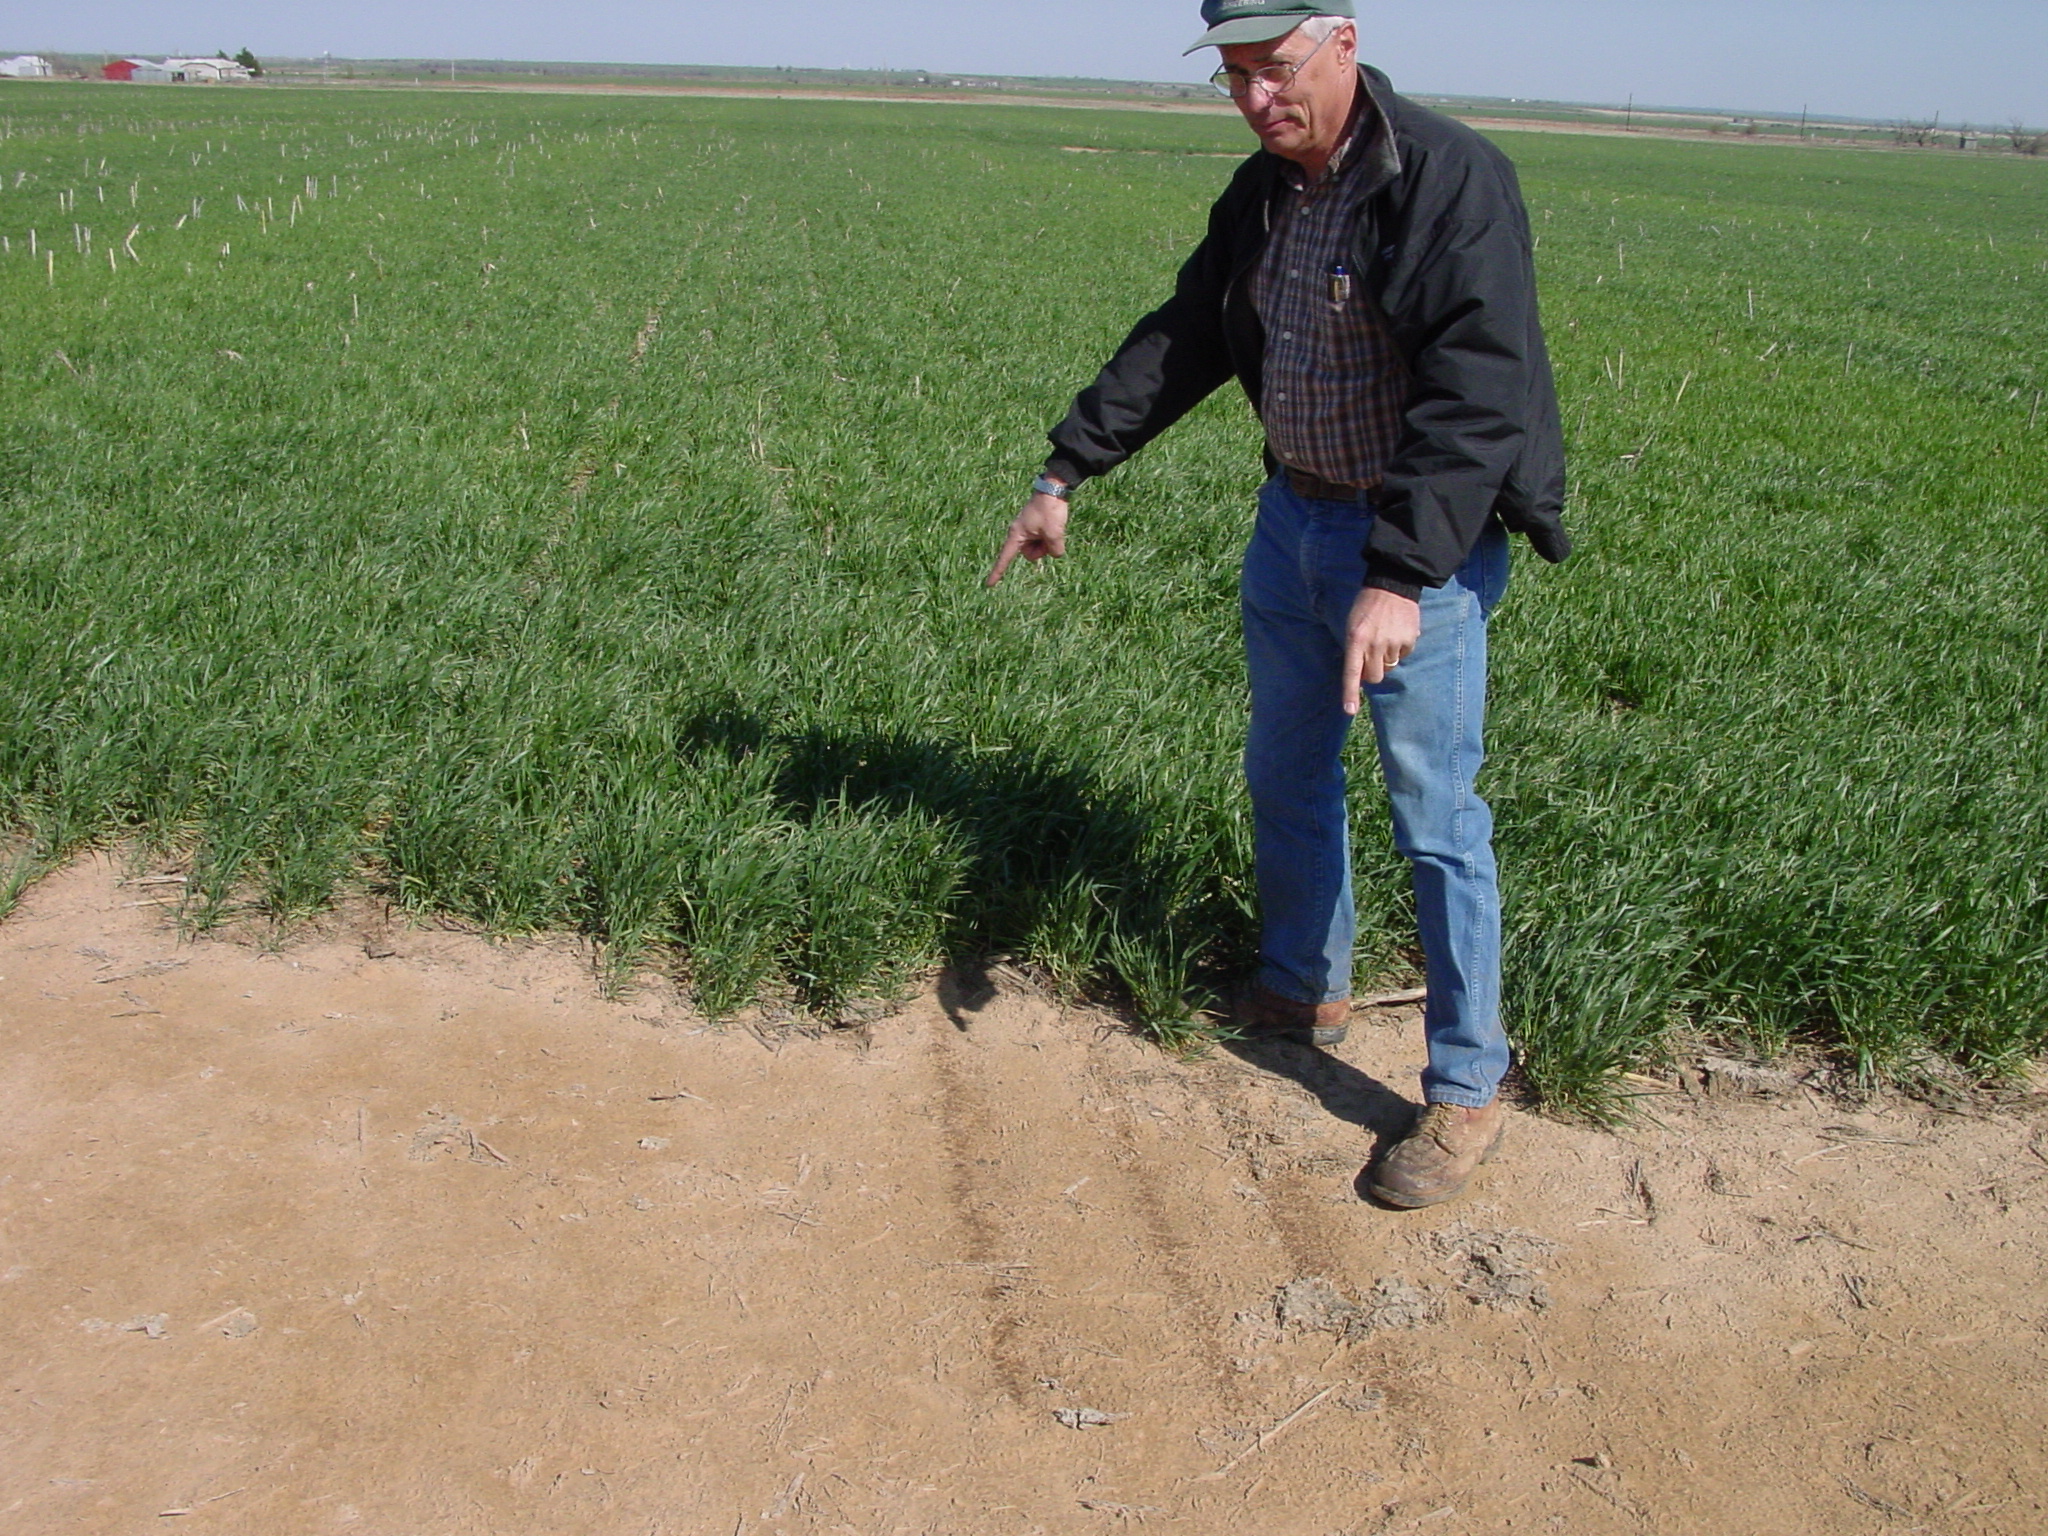
Check Plots
![]()
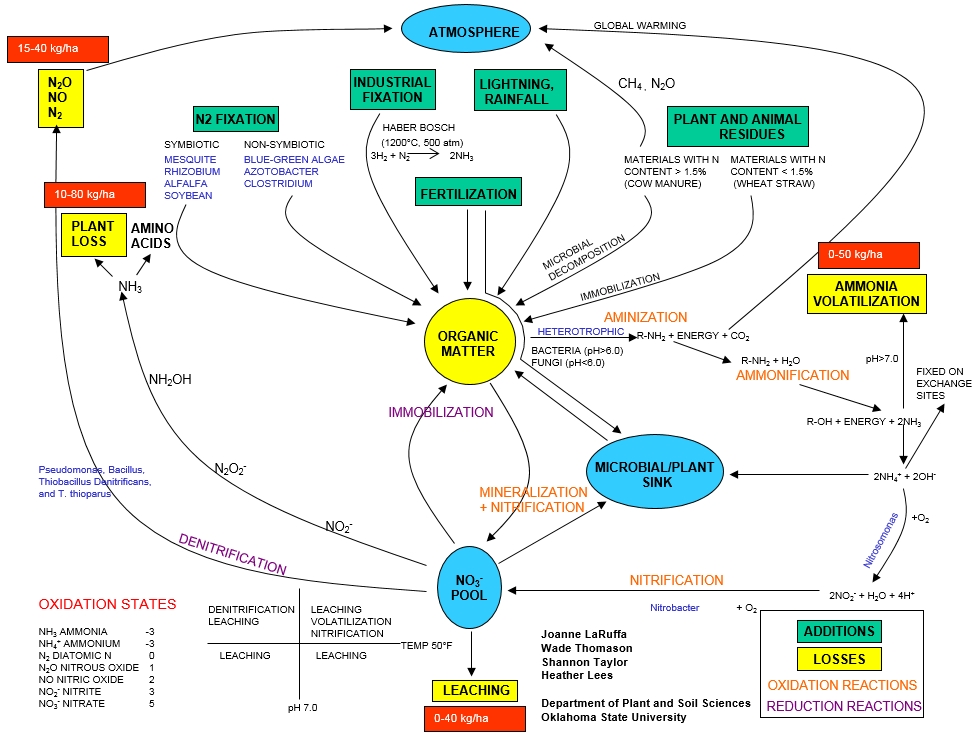
 N Cycle
NCR-rate recommendations, Bundy (no change in N Rates over time?)
Variability in Optimum Nitrogen Rates for Maize (Dhital and Raun, 2016) Does the Bundy paper make sense?
Catch UP (conclusions), Brixey 2006 CV less than 18, MaxYield obtained from mid-season N applications
A. Algorithm Page (Sufficiency approach, leap of faith)
![]()
CV-RI
(excel file, sensitivity analysis, homework)
Concept, CV-RI
(excel file)
CV RI Homework
SAS Programs Examples/homework (LAST week of class)
ABSTRACT EXERCISE (see examples on NUE)
N DEMAND, ABSTRACT
Maize (Zea mays L.) grain yield levels and the response to fertilizer
nitrogen (N) are expected to change from year to year and location to
location. Because yield level and N response have been documented to be
independent, and known to influence N demand, optimum N rates at the same
location are expected to change each year due to unpredictable changes in
the environment. The objective was to further analyze maize grain yield
levels and optimum fertilizer N rates from published data in the Central
Great Plains of the United States. Optimum N rates were determined by
calculating the difference in N uptake between the highest yielding plot
and the check plot (no N applied). The difference in grain N uptake
between the fertilized and zero-N check plot was then divided by 0.33
(average N use efficiency) to estimate optimum N rate, by site and year.
For the 198 site-years of data included, grain yields in both the high N
rate, and check (0-N) plots were highly variable. Also, optimum N rates
fluctuated from year to year at all locations. Optimum N rates were not
highly correlated with the high N rate yield (R2=0.20) or zero-N check
yield (R2=0.16). The wide range in optimum N rates observed in all maize
experiments suggests the need to adjust N rates by year and location. This
is possible using mid-season sensor based technologies that can accurately
predict yield potential (expected yield level), and simultaneously
encumber N responsiveness known to be independent of yield.
SENSOR BASED ALGORITHMS, ABSTRACT
The demand for improved decision making
products for cereal production systems has placed added emphasis on using
plant sensors in-season, and that incorporate real-time, site specific,
growing environments. The objectives of this work were to describe
validated in-season sensor based algorithms presently being used in cereal
grain production systems for improving nitrogen use efficiency (NUE) and
cereal grain yields. A review of research programs in the Central Great
Plains that have developed sensor-based nitrogen (N) recommendations for
cereal crops was performed. Algorithms included multiple land-grant
university, government, and industry programs. A common thread in this
review is the use of active sensors, particularly those using the
Normalized Difference Vegetation Index (NDVI) for quantifying differences
in fertilized and non-fertilized areas, within a specific cropping season.
In-season prediction of yield potential over different sites and years is
possible using NDVI, planting date, sensing date, cumulative growing
degree days (GDD), and rainfall. Other in-season environment-specific
inputs have also been used. Early passive sensors have advanced to
by-plant N fertilization using active NDVI and by-plant statistical
properties.
Most recently, sensor-based algorithm
research has focused on the development of generalized mathematical models
for determining optimal crop N application. The development and promotion
of fee-based modeling approaches for nutrient management continues.
Nonetheless, several algorithms using
active sensors for in-season N management are available from state and
government sources at no cost and that have been extensively field tested
and can be modified by producers......
For Iowa (largest tonnage of fertilizer N
purchased and applied in the US), this has become somewhat uncomfortable
as within-state lawsuits have been filed against maize (Zea mays L.)
producers surrounding the Des Moines and Raccoon rivers for over applying
N (Charles, 2015). Solutions exist but involve practices that will require
a significant investment in equipment and management (Roberts et al.,
2012).
What did The Check Plots Yield? (WORD DOCUMENT with SAS)
In long-term experiments,
grain yields of the check plot (no N applied) can reveal added information
about the environment when studied alone.
The objective of this work was to
further evaluate check plot yields and how they changed over time.
Furthermore, changes in check plot
yields were expected to provide a better understanding of fertilizer N
response and yield potential.
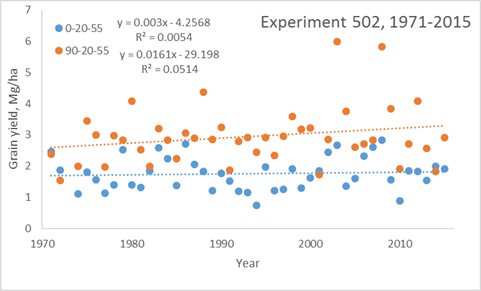
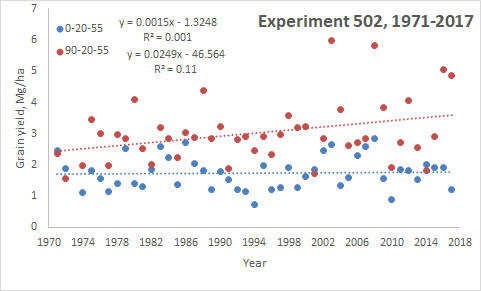
Two long-term experiments, were targeted
for added analysis, Experiment 222 near Stillwater, OK, and Experiment
502, just west of Lahoma, OK.
Check plots had the same variability
over years as did the nitrogen (N) fertilized plots, with CV’s for both
near 30%.
Means and standard deviations
(Experiment 502) were 1.76 ±0.53 and 2.95±0.92 Mg/ha for check and N
fertilized plots, respectively.
World Phosphorus use Efficiency in Cereal Crops, ABSTRACT
FINAL: World Phosphorus Use Efficiency in Cereal Crops ABSTRACT A current estimate of global phosphorus use efficiency (PUE) for cereal production is not available. The objectives of this paper were to estimate PUE for cereal crops grown in the world and to review methods for improvement. Phosphorus use efficiency was determined using world cereal harvested area, total grain production, and phosphorus (P) fertilizer consumption from 1961 to 2013, in addition to assumptions established from previous literature. World PUE of cereal crops was calculated using both balance and difference methods. Using the balance method, cereal grain P uptake is divided by the P fertilizer applied. Alternatively, the difference method accounts for P coming from the soil and that is subtracted from applied P. Utilized in this analysis is the estimate that cereal production accounts for 61% of the total harvested cropland. Cereal grain yields increased from 1.35 Mg ha-1 to 3.90 Mg ha-1 between 1961 and 2013. In 1961, the world’s fertilizer P consumption was 4,770,182 Mg and increased to 16,662,470 Mg of P fertilizer by 2013. This represents a 3.5x increase in P fertilizer consumption over 53 years. Phosphorus use efficiency estimated using the balance method was 77%. Using the difference method, PUE for cereal production in the world was estimated to be 16%.
NEXT to Final: A current estimate of global phosphorus use efficiency for cereal production is not available. The objective of this paper was to estimate P use efficiency for cereal crops grown in the world today. Phosphorus use efficiency (PUE) was determined using world cereal harvested area, production, and P fertilizer consumption from 1961 to 2013, in addition to assumptions established from previous literature. World PUE of cereal crops was calculated as the amount of cereal grain P removed minus P in the grain coming from the soil and divided by the amount of P fertilizer applied. Utilized in this analysis was the value for cereal production, accounting for 47.9% to 61.3% of the total agricultural land. Cereal grain yields increased from 1.35 Mg ha-1 to 3.90 Mg ha-1 between 1961 and 2013. In 1961, the world’s fertilizer P consumption was 4,765,810 Mg and increased to 17,678,101 Mg of P fertilizer by 2013. This represents a 371% increase in P fertilizer consumption over 52 years. This study shows that world PUE of cereal crops are generally low, with considerable opportunity to promote improvements in the use of P fertilizers. Global PUE for cereal crops has ranged from 12 to 20% (1980 and 2008, respectively) with present estimates of 21 % in 2013.
Improving Nitrogen Use Efficiency for Cereal Production (1999)
Abstract
Worldwide, nitrogen use efficiency (NUE) for cereal
production (wheat, Triticum aestivum L., corn, Zea mays L., rice, Oryza
sativa L., barley, Hordeum vulgare L. sorghum, Sorghum bicolor, L. ,
millet, Pennisetum glaucum L., oats, Avena sativa L. and rye, Secale
cereale L.) is approximately 33%. The unaccounted 67% represents a $15.9
billion annual loss of N fertilizer (assuming fertilizer-soil
equilibrium). Loss of fertilizer N results from gaseous plant emission,
soil denitrification, surface runoff, volatilization, and leaching.
Increased cereal NUE is unlikely unless a systems approach is implemented
that uses varieties with high harvest index, incorporated NH4-N
fertilizer, application of prescribed rates consistent with in-field
variability using sensor-based systems within production fields, low N
rates applied at flowering, and forage production systems. Furthermore,
increased cereal NUE must accompany increased yields needed to feed a
growing world population that has yet to benefit from the promise of
N-fixing cereal crops. The Consultative Group on International
Agricultural Research (CGIAR) linked with advanced research programs at
universities and research institutes is uniquely positioned to refine
fertilizer N use in the world via the extension of improved NUE
hybrids/varieties and management practices in both the developed and
developing world.
SBNRC-IOWA, Russ Linhardt (also,
2010, 2011 wheat)
(502 testing
of SBNRC?)
Use of GDD, INSEY, Mesonet
World Computation of NUE (Agronomy Journal 1999, 91:357)
SED = square
root (2*MSE/reps) = square root (2*s2/reps)
LSD = t,dfe,alpha
0.05 *SED
CV = (Standard Deviation / population mean) *100
or, (Square root of the variance / population mean) *100
-----------------------------------------------
-----------------------------------------------
STOP
N Cycle (Yield Level, N Response)
12. Foliar UAN for Mitigating Frost Damage
13. Nitrogen Cycle
Rates of Salt (N+K2O) that can be applied with the
seed (1986
Fertilizer Solutions Article)
Spring2014/IMG_x.pdf
14.
Argentina, NO-TILL
Success
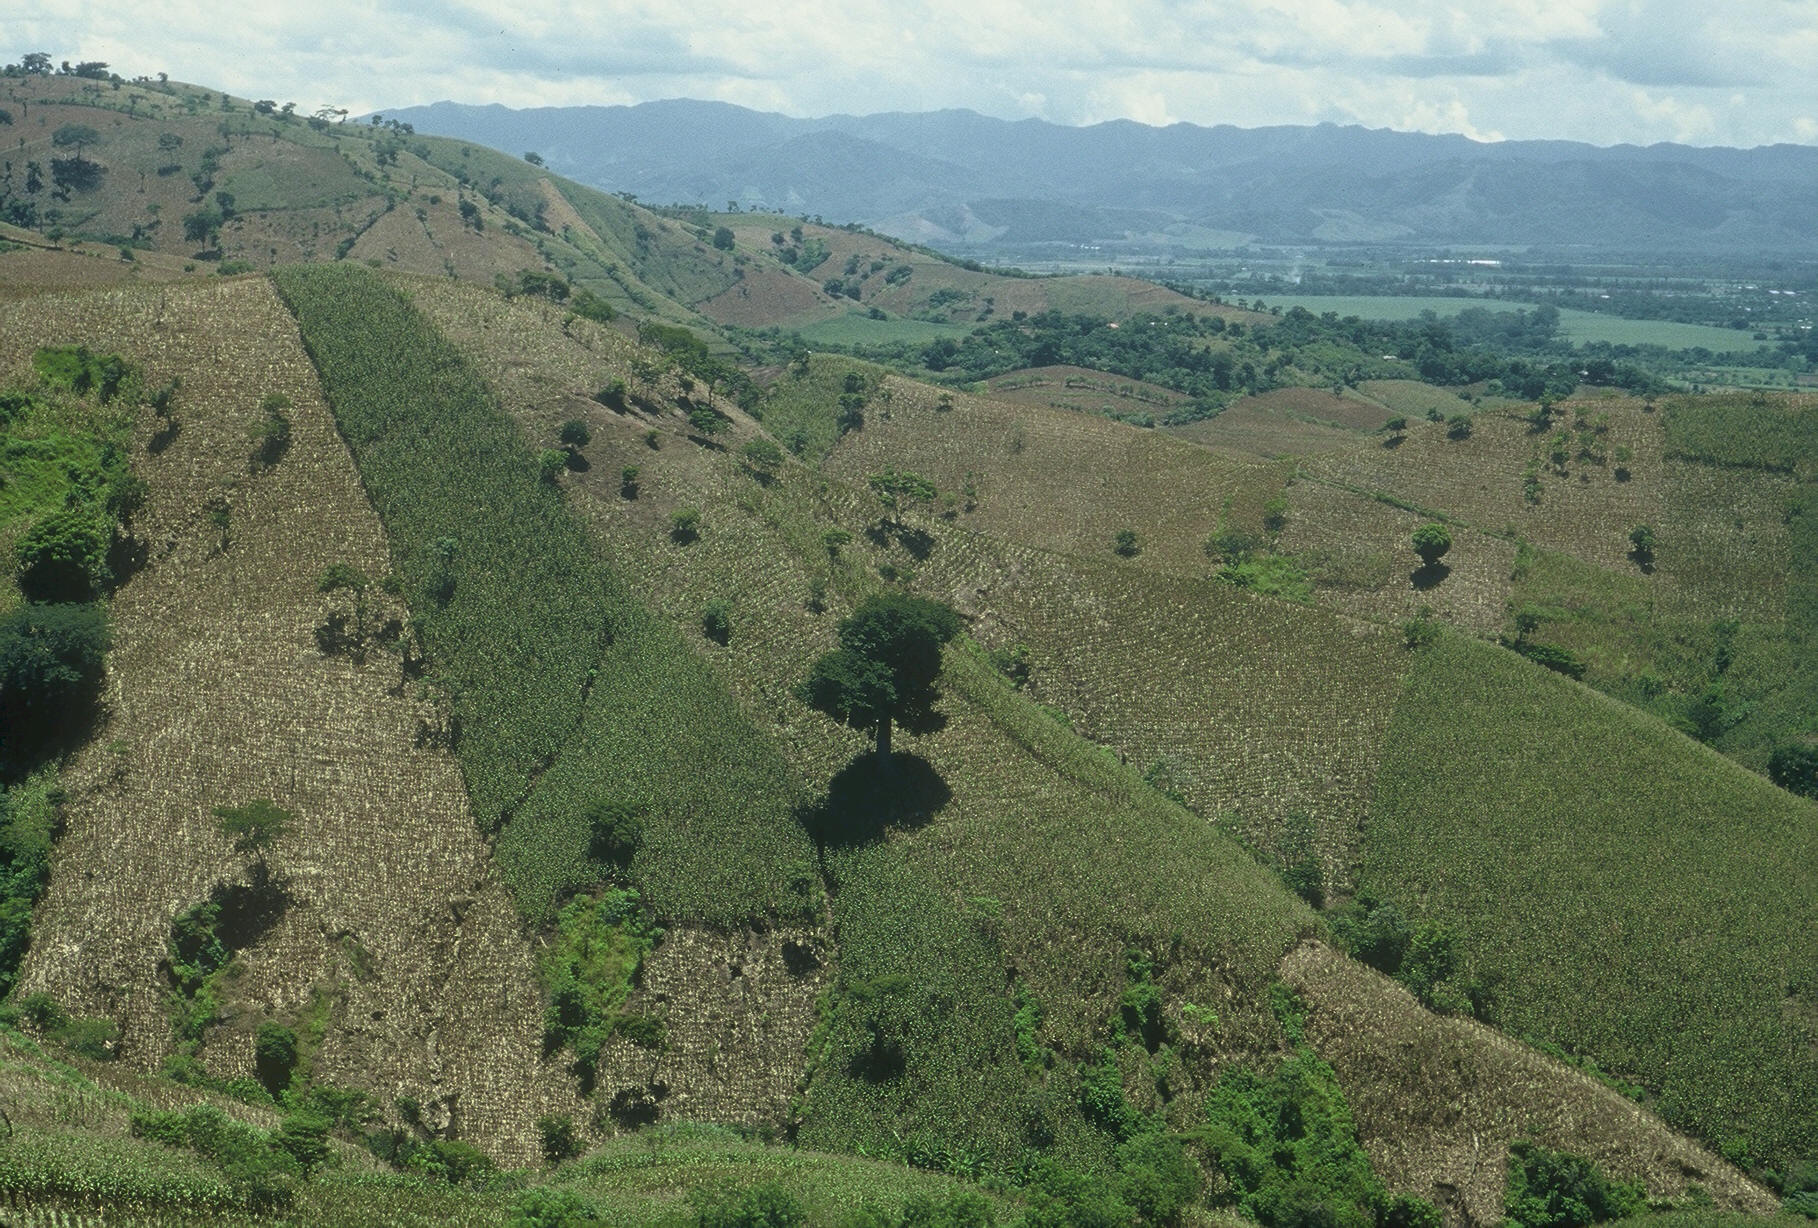
Leguminous trees of the genera Sesbania,
Tephrosia, Crotalaria,
Glyricidia, and Cajanus are interplanted into a
young maize crop and allowed to grow as fallows during dry seasons,
accumulating 100 to 200 kg N/ha over the period from 6 months to 2 years
in subhumid tropical regions of East and Southern Africa. The quantities
of nitrogen captured are similar to those applied as fertilizers by
commercial farmers to grow maize in
developed countries.
"The approach reported here is effective and more appropriate to current African conditions than those used during the Green Revolution. These low-tech but knowledge-intensive technologies should precede the promise of genetic engineering and other high-tech approaches, because without available nitrogen and phosphorus in the soil African farmers have no chance of succeeding.
17.
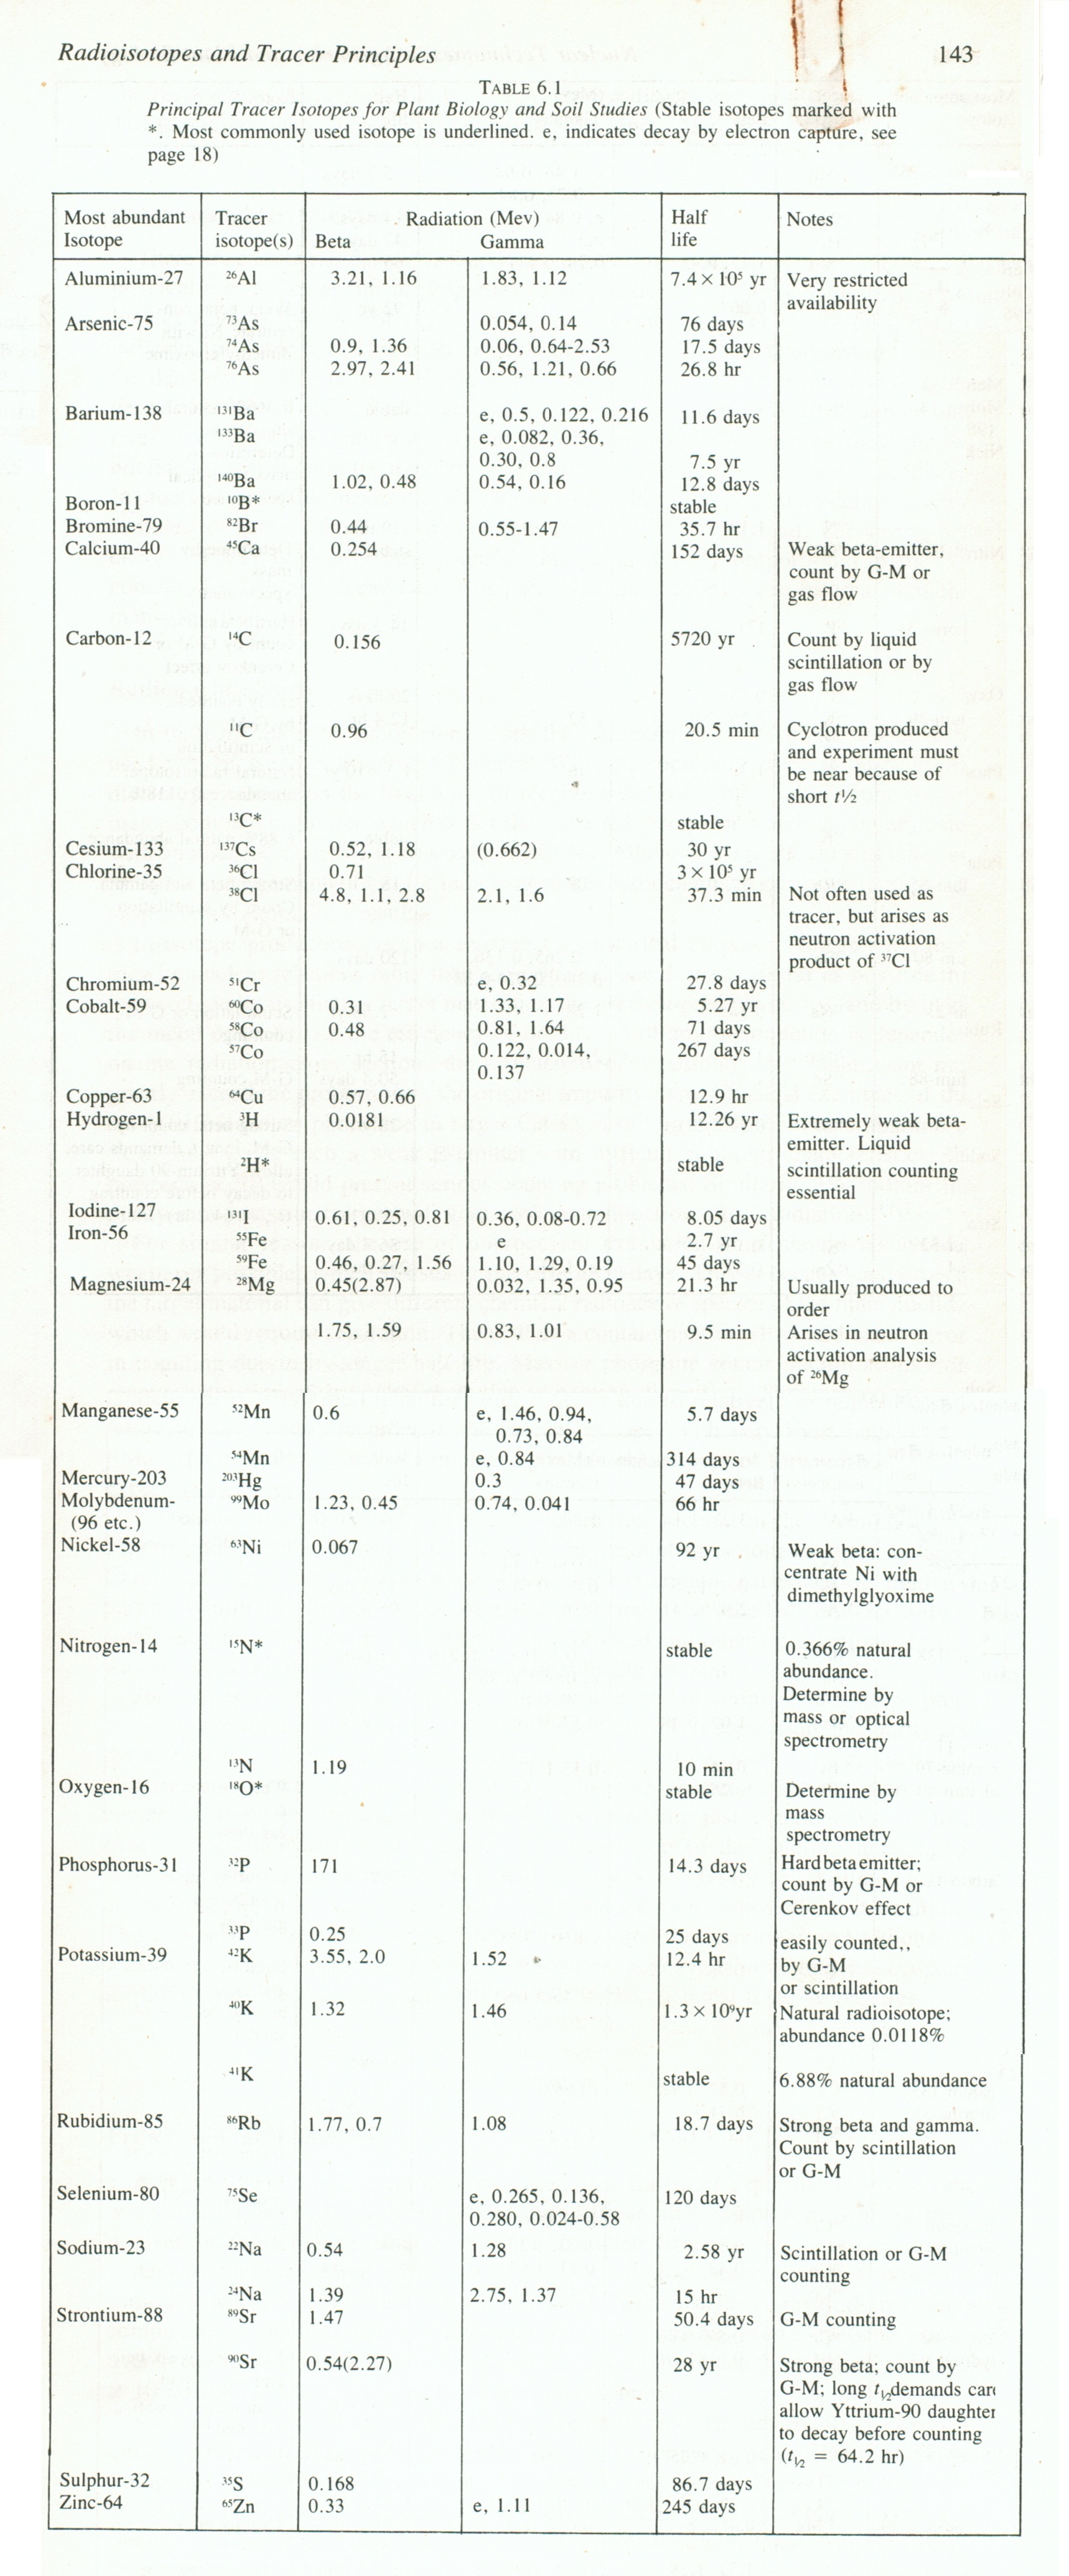
Radioisotopes
supplemental lecture
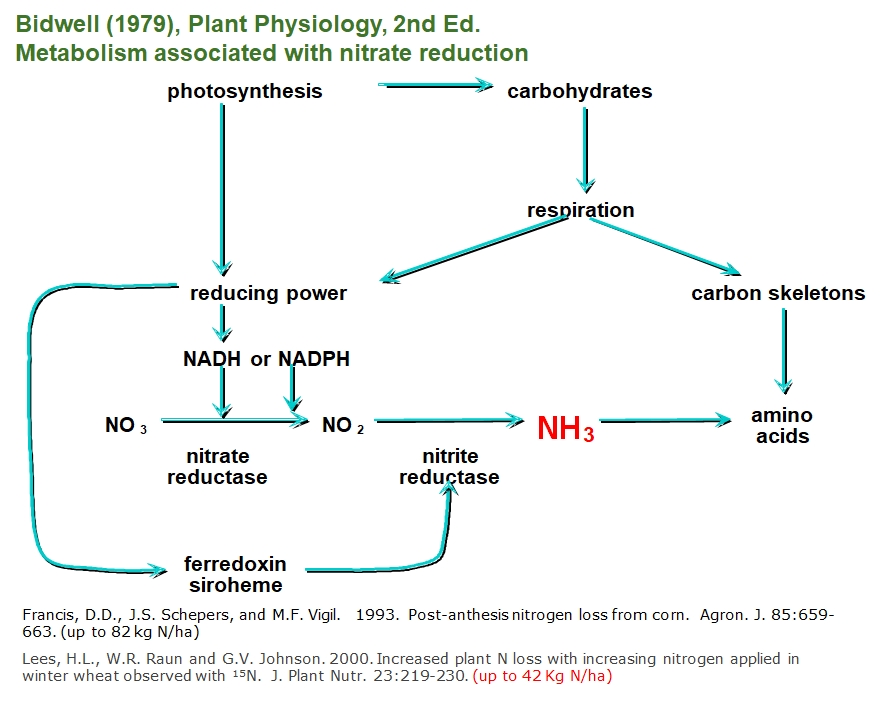
Increased plant N loss with increasing nitrogen applied in winter wheat observed with 15N. J. Plant Nutr. 23:219-230. (pdf)
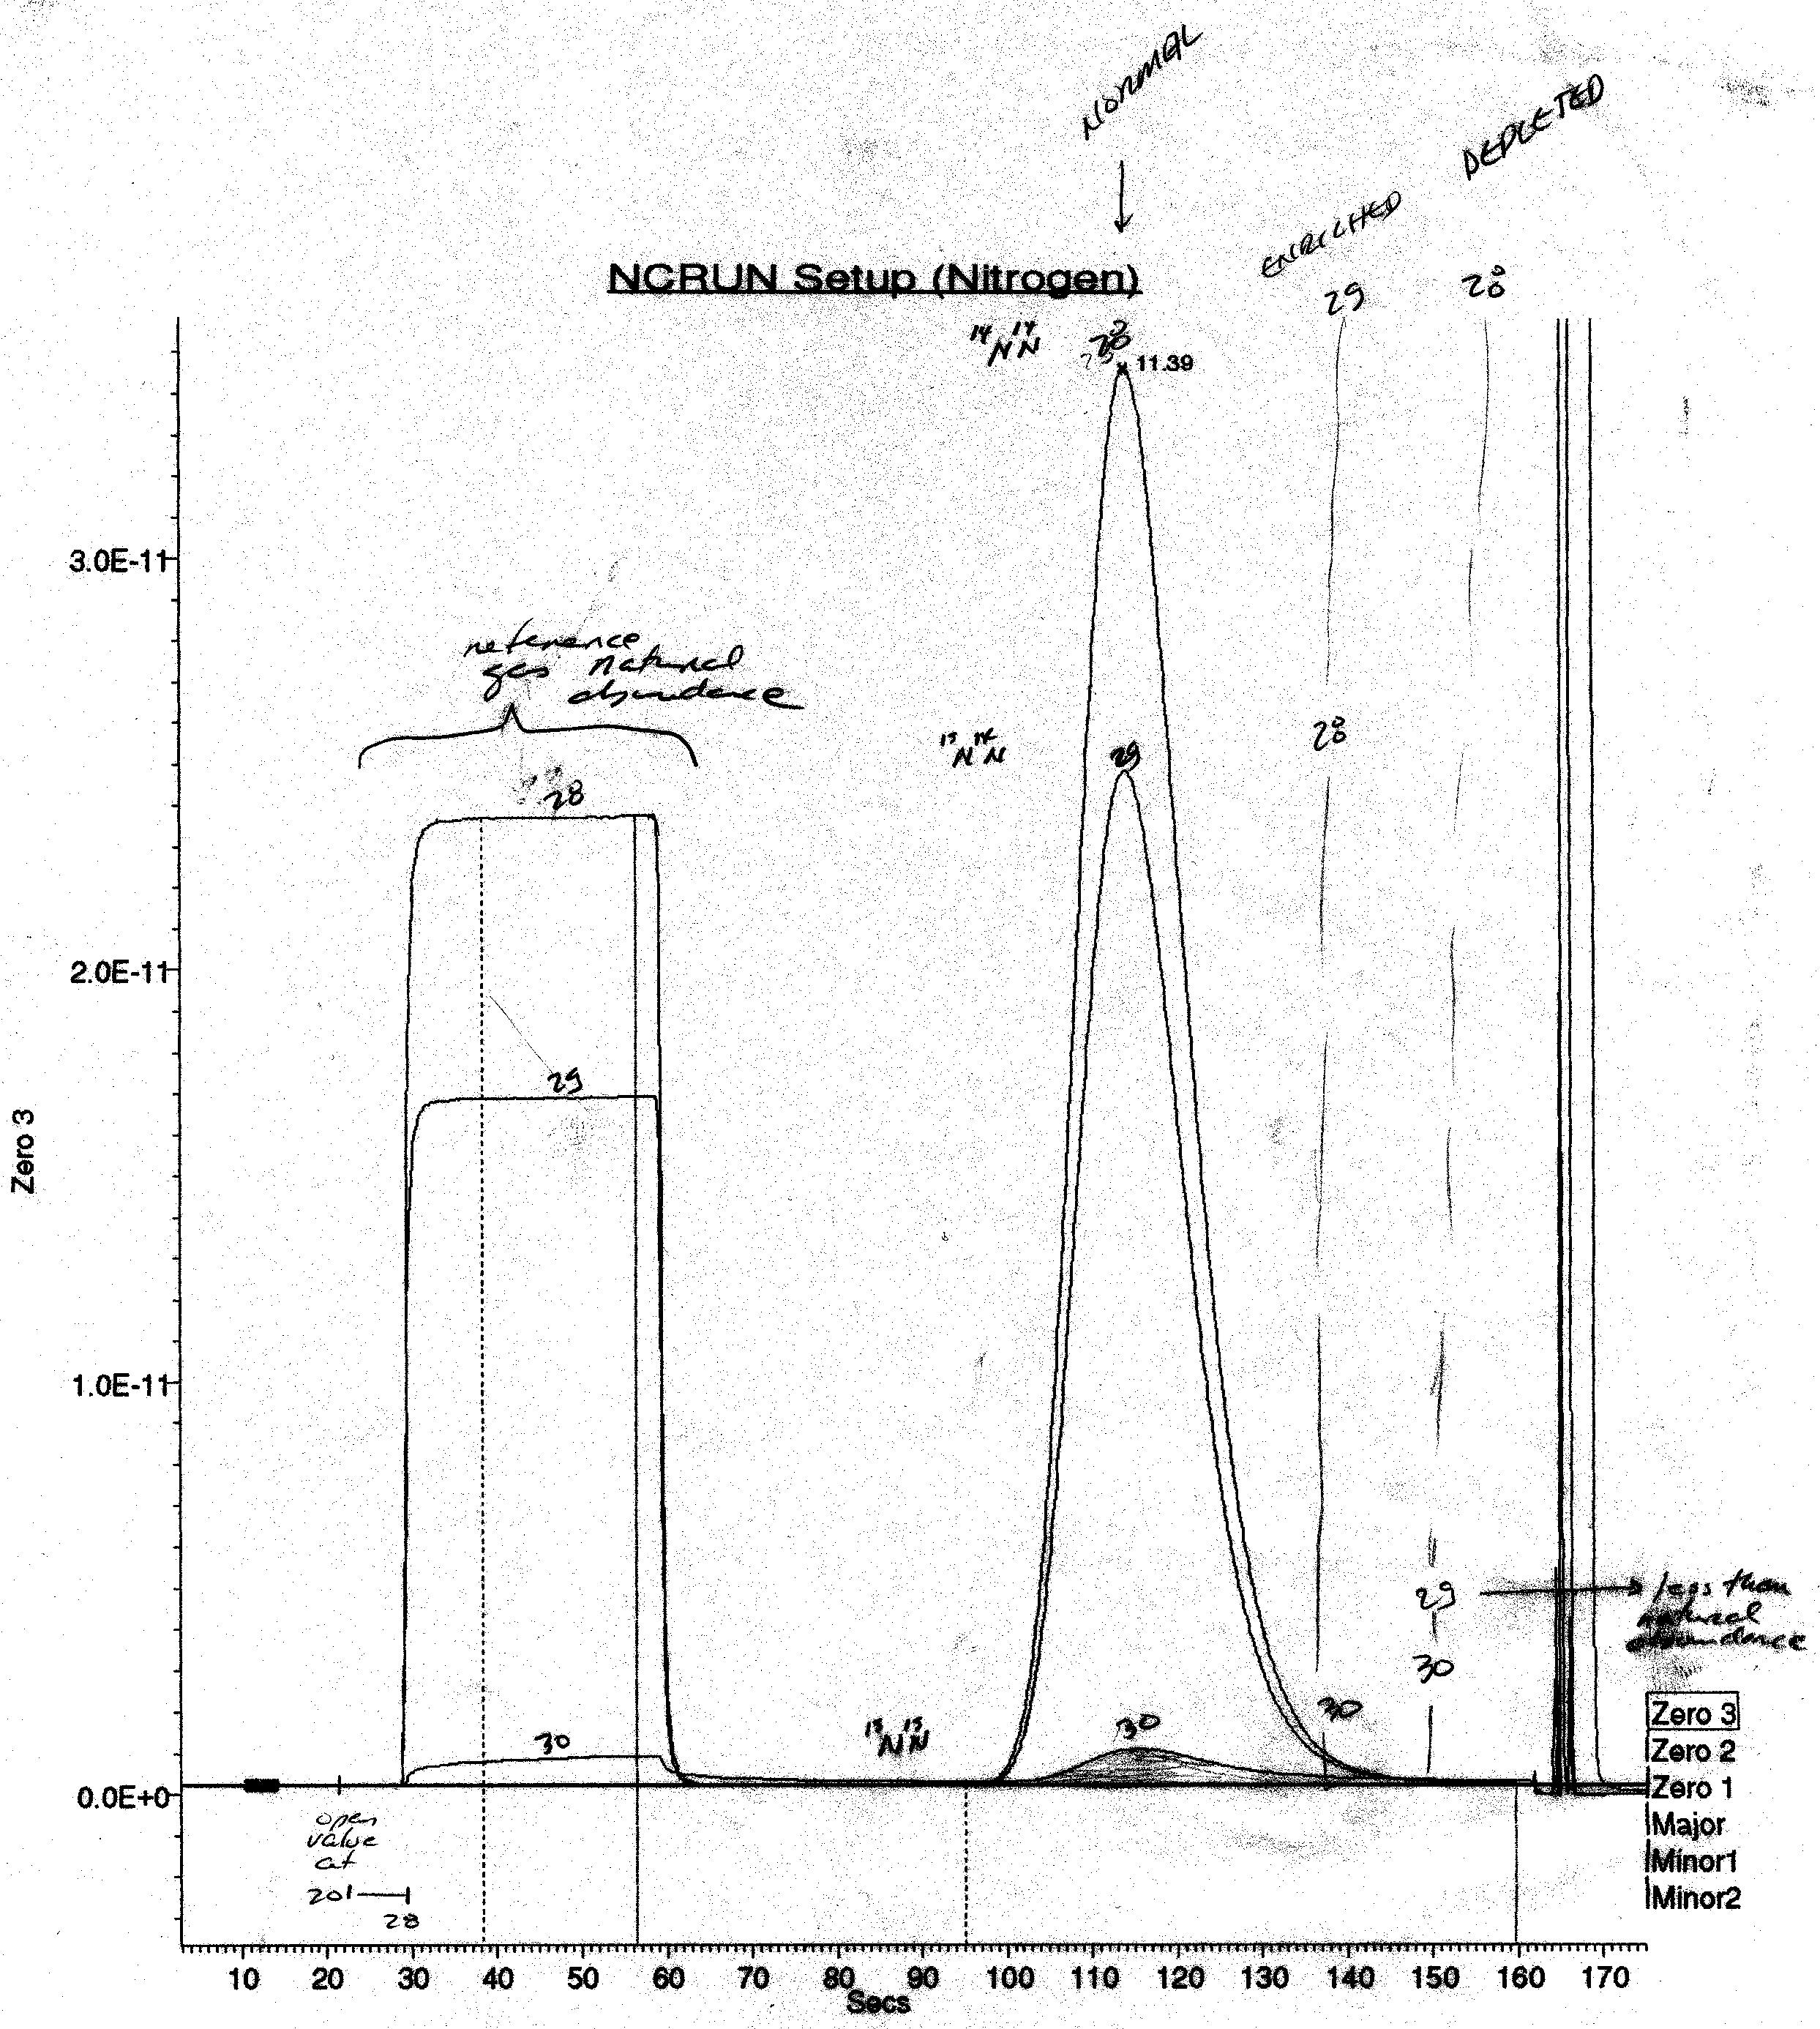 Mass Spec Output
Radioisotopes (List) from Vose
ETHANOL
18. Added Topics, Cellulosic Ethanol,
Biofuels lead to food shortages
19. Direct Seeding in Argentina (Agustin Bianchini)
--------------------------------------------------------
9.
Biometrical Applications (class survey)
Stability Analysis (excel)
Stability Analysis 502
REVIEW
(Soybean N Balance, Andres Patrignani, Romulo Lollato.)
Andres Patrignani- Wheat yield plateau
https://www.agronomy.org/publications/aj/view/first-look/aj14-0011.pdf
12. Biofools
13. Ethanol
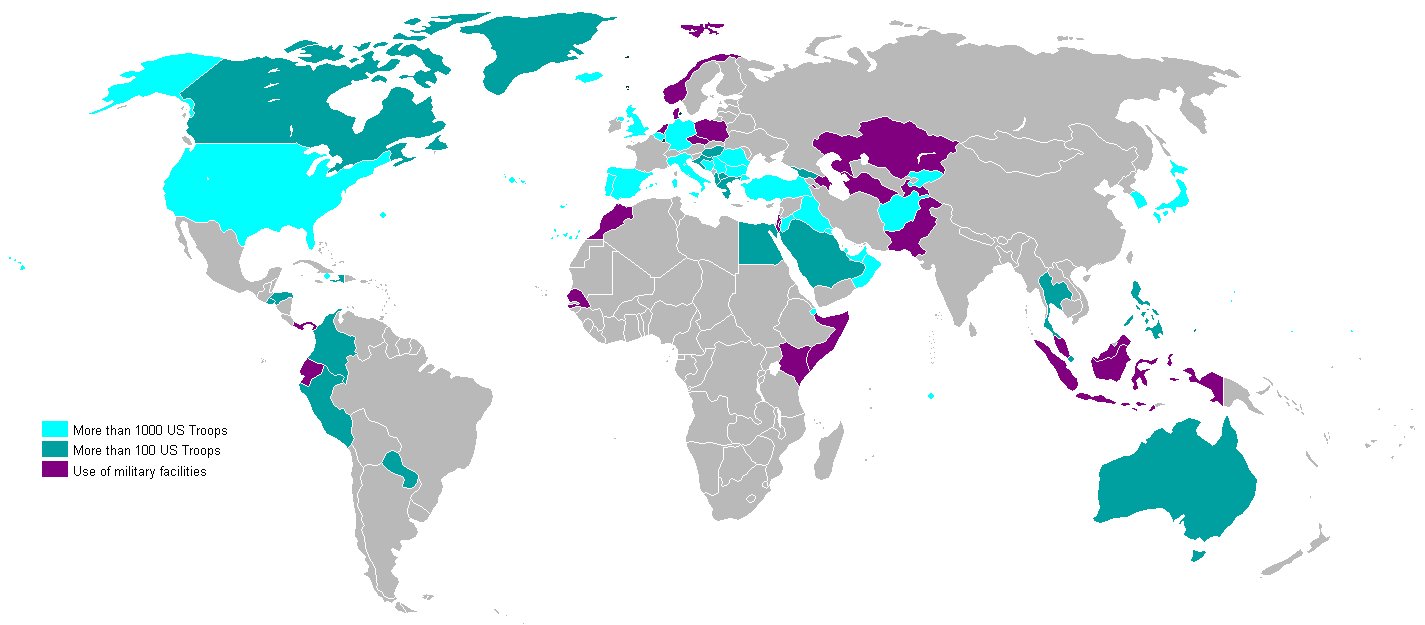
US Military
(wikipedia)
Military Consumption of Energy
14. Resurgent Forests Can be Greenhouse Sponges (Science)
16.
The Magruder Plots, Untangling the Puzzle. (Agron J. 1191-1198)
17. The Story of Wheat (from the Economist.com)
Radioisotope Exercise (with answers)
NEWTON
Inverse Distance Square Law
5813 BOOK, 2015
1. The Future of Agriculture: (Nature)
see Greenseeker/Marv Stone, John Solie
2. Estimated Increase in Atmospheric Carbon Dioxide Due to worldwide decrease in Soil Organic Matter3. Estimated land area increase of agricultural ecosystems to sequester excess atmospheric carbon dioxide. Commun. Soil Sci. Plant Anal. 32:1803-1812. pdf
3. The Ocean's Carbon Balance
4.
Increased plant N loss with increasing nitrogen applied in winter wheat
observed with 15N. J. Plant Nutr. 23:219-230.
5.
Post-anthesis
nitrogen loss from corn. Agron. J. 85:659-663. (Francis
et al., 1981)
6.
Effect
of nitrogen rate on plant nitrogen loss in winter wheat varieties.
Desta et al. (1997). J. of Plant Nutr. 20:389-404. (pdf)
7. Gaseous
Nitrogen Loss from Soybean Foliage
(Stutte)
Why is NUE in the world so important? Why are these numbers so useful?
World Estimates of N, P, K, and S, Use Efficiency (Cereals)
8.9 (above)
10. Cereal nitrogen use efficiency in Sub Saharan Africa. J. Plant Nutr. 32:2107-2122.
11. NEW York Times Article
12. Bogota, Colombia, No Car Day, Feb 1, 2018 (population 8.01 million, started in 2000).
February 6, No Car Day (Bogota, Colombia).
World Contributing Factors
to Global Warming and Total Percentages of GHG Emission
|
Factors |
GHG (Greenhouse
Gas) |
Percentage |
Reference
|
|
Electricity |
CO2 (carbon
dioxide) |
70% |
A. |
|
Livestock |
CH4 (methane) |
35% |
G. |
|
Tillage |
CO2 (carbon
dioxide) |
6-25% (mean: 15.5%) |
D. |
|
Deforestation |
CO2 (carbon
dioxide) |
21% |
F. |
|
Transportation |
CO2 (carbon
dioxide) |
14% |
B. |
|
TOTAL: |
|
155.5% |
|
14. Nitrogen Balance in the Magruder Plots Following 109 Years in Continuous Winter Wheat J. Plant Nutr. 26:1561-1580. (pdf)
15 A. Variability in Optimum Nitrogen Rates for Maize. Agron. J. 108:2165-2173. (doi:
15 B. excel file (ALL SITES) READ last sentence of SULU abstract
16. Independence of Yield Potential and Crop Nitrogen Response (2010). J. Prec. Agric.
17A. Relationship between Grain Crop Yield Potential and Nitrogen Response. (2013). Agron. J.
17B. Unpredictable Nature of Environment on Nitrogen Supply and Demand (2nd Law of Thermodynamics), Agron. J.
Entropy and the 2nd Law of Thermodynamics (YP0 , RI)
18. What did the Check Plots yield? (excel file)
19. 502 Data Base
502 site
a. have to be willing to learn
b. have to be willing to think about the final product
c. have to be willing to be wrong
d. have to be willing to not get any credit
START: 2/17/2020
Research Methods (Stability Analysis)
Increased yields as a function of time in the fertilized plots and no change in the check plots represents improved genetics and the reliance on added N.
20. Use of Stability Analysis for Long-Term Soil Fertility Experiments. Agron J. 85:159-167.
STABILITY ANALYSIS page (5112), from quiz question, Did Dr. Borlaug seek broad adaptation? Go to excel file, Sarah Battenfield
Magrduer EMAG_17
Magruder 2019, Stability 1 (Manure vs Check)
What defines "Environment?"
How can I mathematically define "Environment?"
Value of stability analysis is recognizing that "environment" encompasses many variables. (elevation, temperature, soil pH, soil texture, weather, disease pressure, tillage, planting date, etc.)
Stability analysis recognizes that yield level is an indicator of "environment"
Do you want to review papers?
Raun, W.R., M. Golden, J. Dhillon, D. Aliddeki, E. Driver, S. Ervin, M. Diaite-Koumba, B. Jones, J. Lasquites, B. Figueiredo, M. Ramos Del Corso, N. Remondet, S. Zoca, P. Watkins, J. Mullock. 2017. Relationship between Mean Square Errors and Wheat Grain Yields in Long-Term Experiments. J. Plant Nutr.
21. Organic CARBON
21a. Ed Wellhausen on Borlaug page
22. Priming Effect of 15N-Labeled Fertilizers on Soil Nitrogen in Field Experiments. SSSAJ, 37:725-727.
23. Nitrogen Balance in the Magruder Plots Following 109 Years in Continuous Winter Wheat J. Plant Nutr. 26:1561-1580.
N Cycle
NUE Definitions
24. Moll et al., 1982. Analysis and Interpretation of Factors Which Contribute to Efficiency of Nitrogen Utilization.
25. OSU, Categories, Moll et al., 1982 partitioned
26. Flowchart, for NUE (components questioned)
27. Cereal nitrogen use efficiency in Sub Saharan Africa. J. Plant Nutr. 32:2107-2122 (turn things on their head)
Nitrogen Cycle
Questions (Update, Nitrogen3) (includes N buffering, NH3 loss, carbon increase with N)
28. Soil-Plant Buffering of Inorganic Nitrogen in Continuous Winter Wheat
29. Seasonal and long-term changes in nitrate-nitrogen content of well water in Oklahoma. 1997. J. Environmental Quality, 26:1632-1637.
30. Critical NO3-N levels (why is groundwater in undisturbed landscapes not >10 ug/g?) Inorganic N Buffering?
31. Nitrous Oxide (Wikipedia)
32. Nitrous oxide emissions (since 1860).
33. Nitrogen Cycle and World Food Production (Smil)
34. Global Population and The Nitrogen Cycle. Smil
35. Haber Bosch (on N cycle)
nitric oxide (NO)
nitrogen dioxide (NO2)
nitrogen oxide pollutants (NOx)
nitrous oxide (N2O)
TIKAL Archaeology
Great Pacific Garbage Patch
MESONET: PHP programming: HTML (Hypertext Markup Language) programming, SBNRC, hand-shaking - winter_wheat_in_ok.inc, MATH at the end.
>50% NUE? Our Approach, left side, NUE page
BY-PLANT, CORN
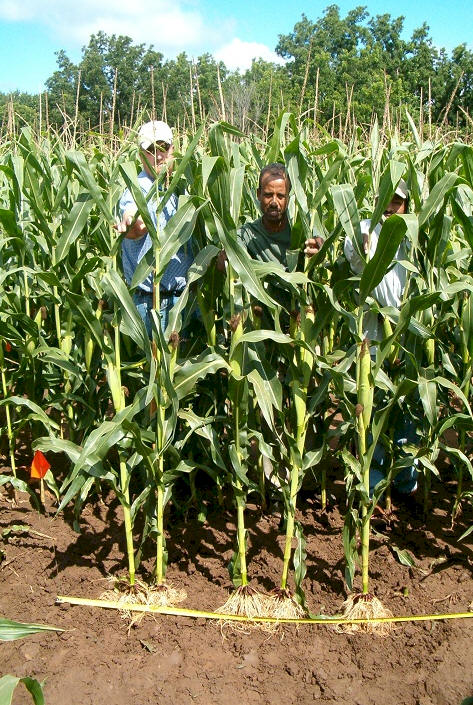
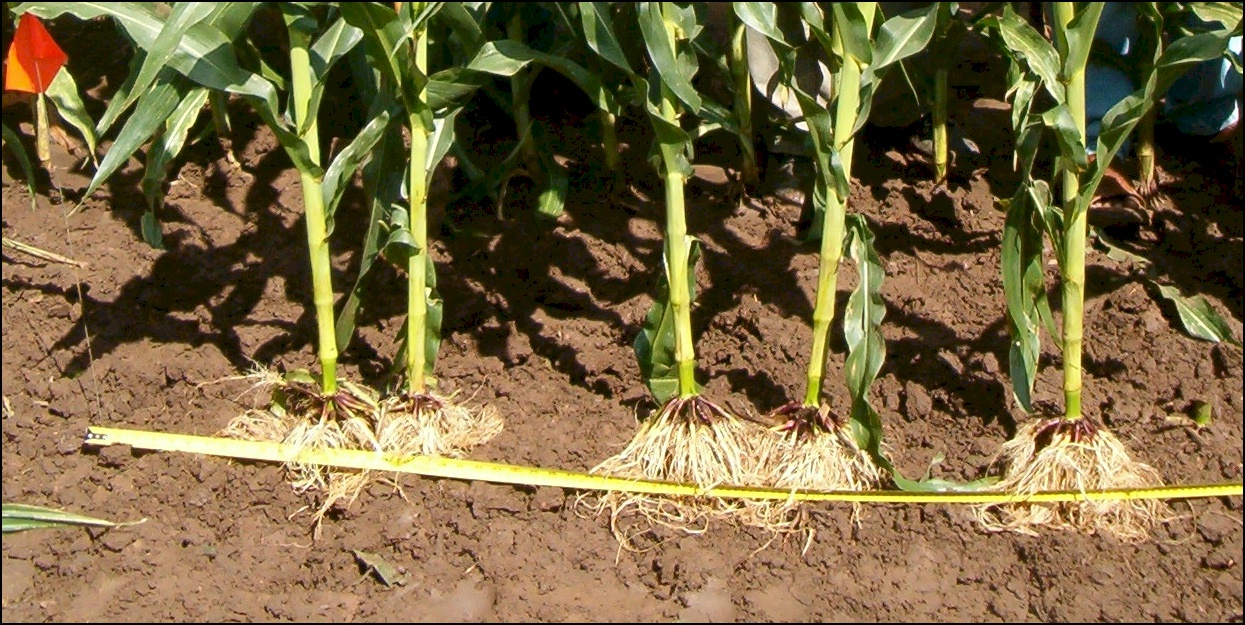
36. By Plant Variability (46 Transects) (importance Solie and Stone)
Plant to Plant Variability in Corn Production (Agron. J. 97:1603-1611) (pdf)
37. By Plant Prediction (plants, bottom of page)
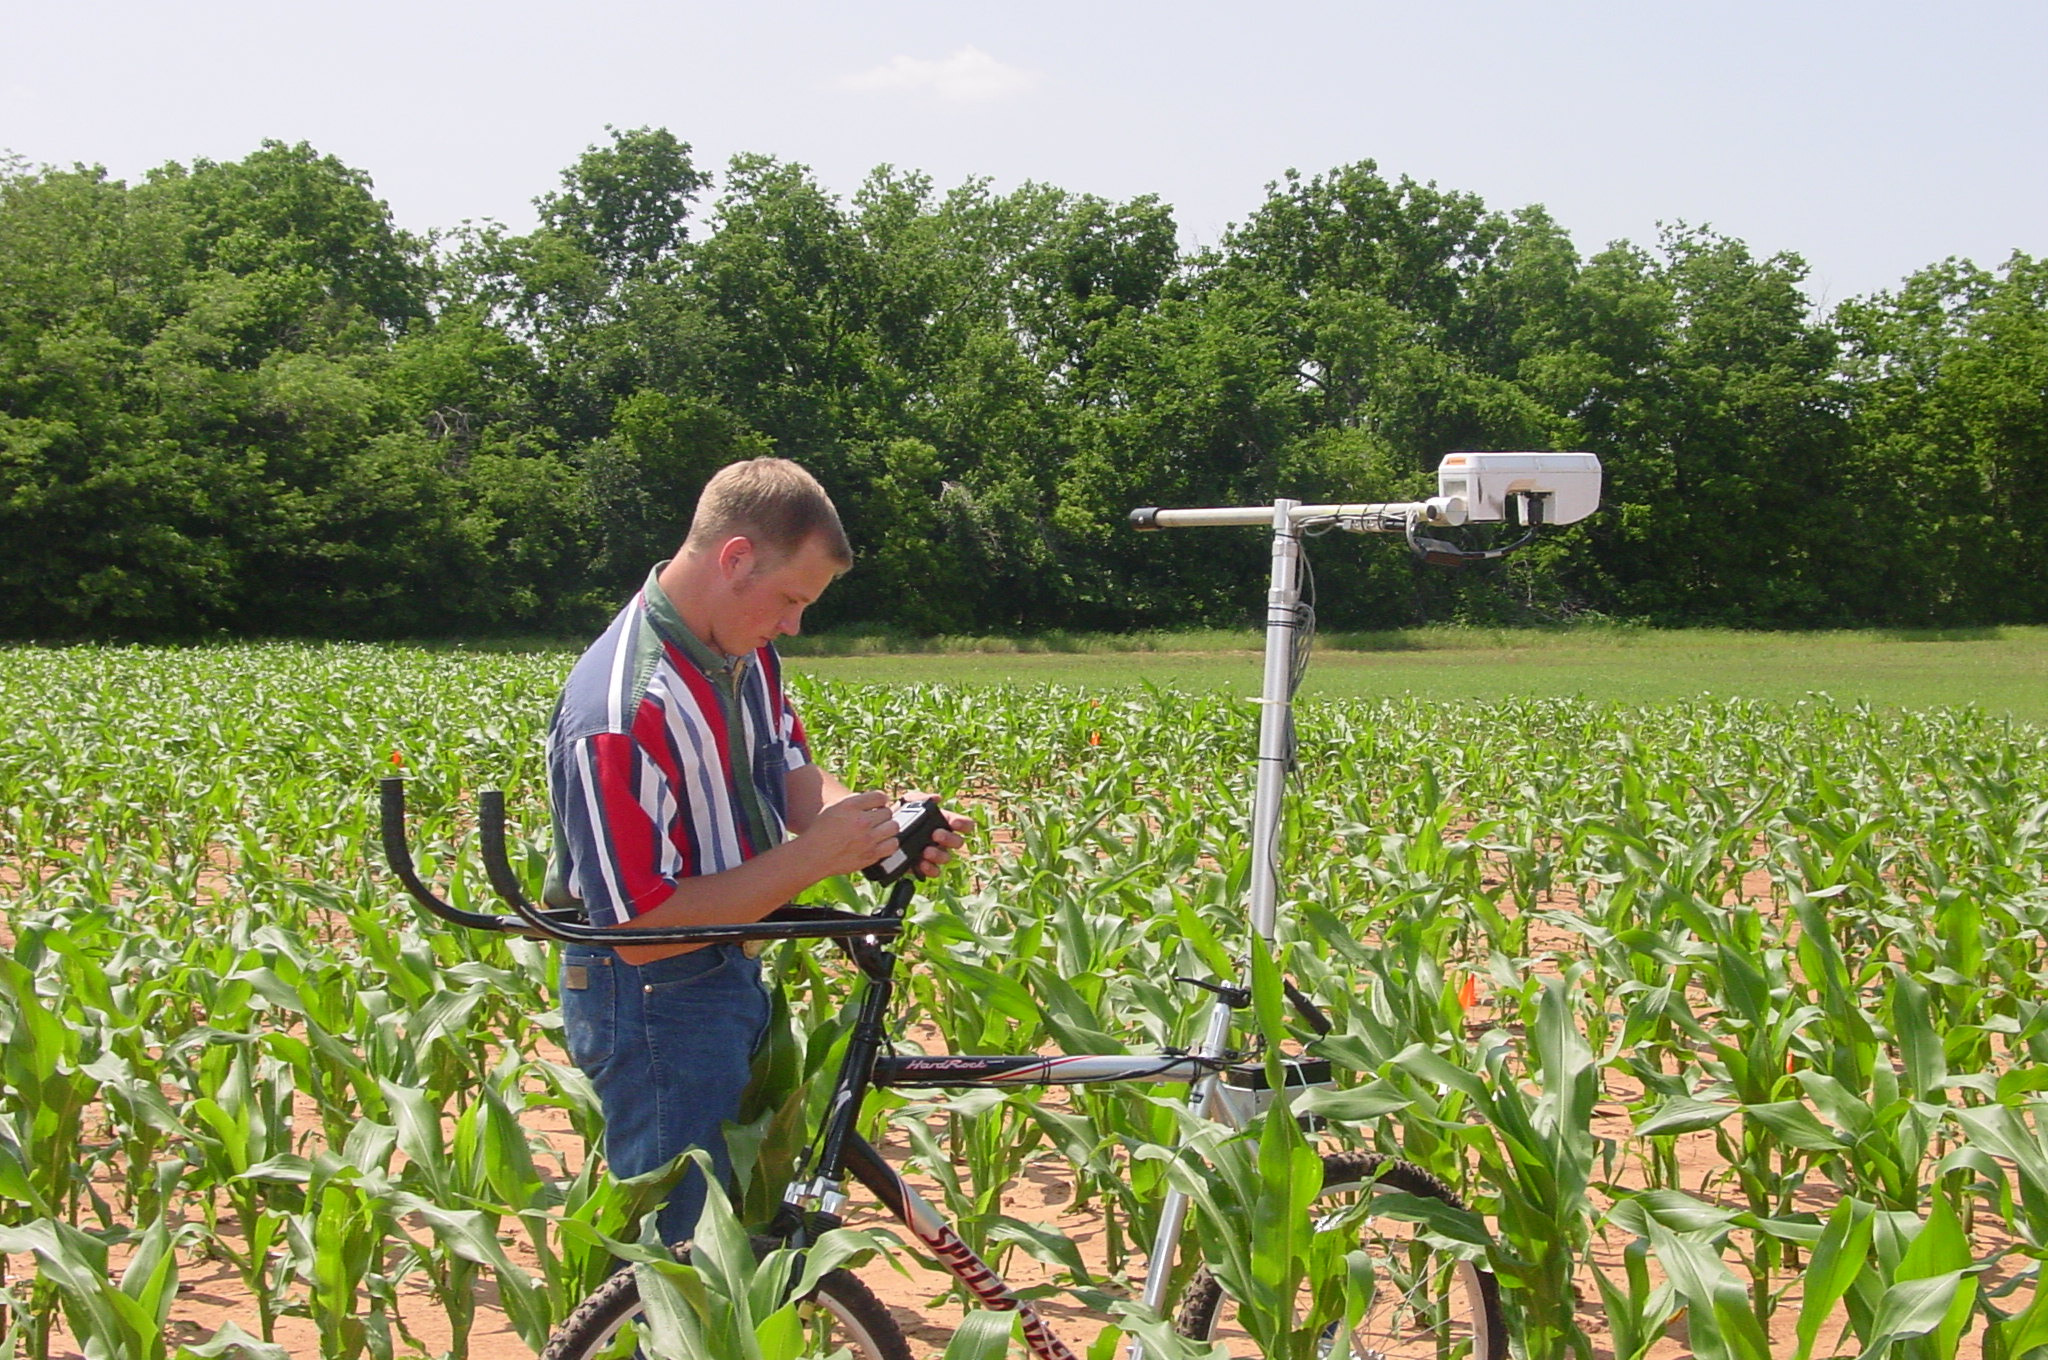
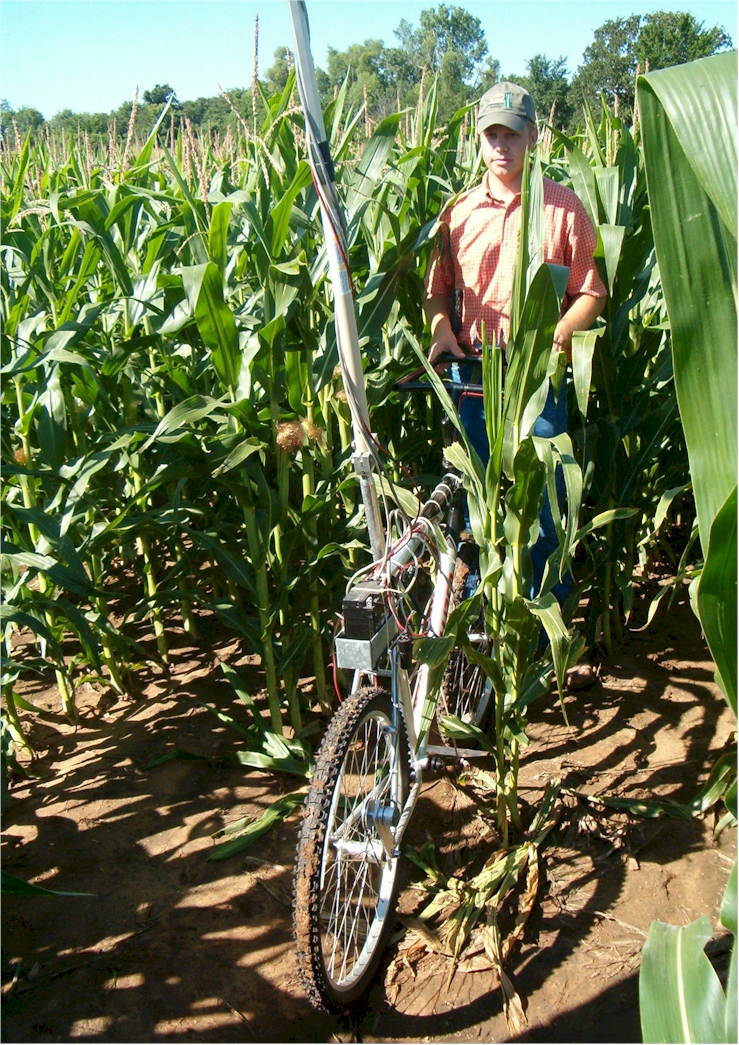
38.1 By plant prediction of corn (Zea mays L.) grain yield using height and stalk diameter. Commun. Soil Sci. Plant Anal. 46:564-575.
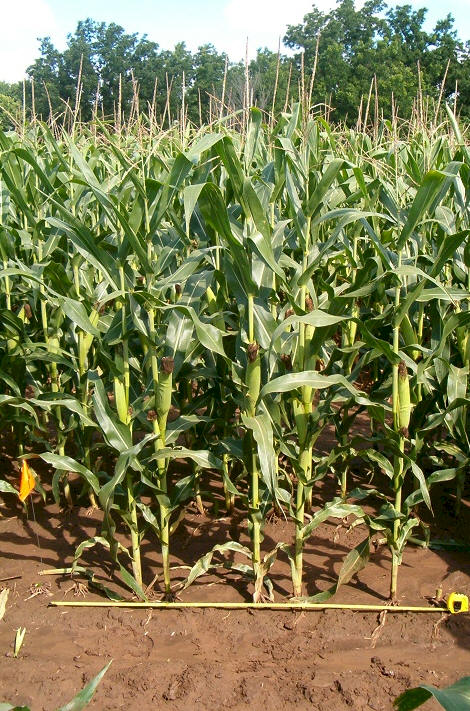
Field Picture (plant excavation, go to Causes of Plant to Plant Variability (NUE page)
38. Plant to Plant Variability in Corn Production (46 Transects, Argentina, Iowa, Nebraska, Oklahoma, Mexico, Virginia, Ohio)
39. The Case for By-Plant N Management
40. Variability in Optimum Nitrogen Rates for Maize. Agron. J. 108:2165-2173. (doi:
40.a. http://nue.okstate.edu/Spatial_N_Variability.htm (corn)
40.b. At What Resolution Should Precision Agriclture Operate?
 40.c Automated
Calibration
STAMP
manuscript (2005) (see page below)
40.c Automated
Calibration
STAMP
manuscript (2005) (see page below)http://nue.okstate.edu/Calibration_Stamp.htm
40.d. RAMP Calibration Strip, manuscript (2008)
RAMP web page (interfacing agronomy and engineering)
41. Can Yield Goals Be Predicted? Agron. J. 109:5, 2389-2395.
EXCEL File (502, Yield Goals) Nutrient Concentrations (wheat grain) PPI (crop nutrient values)
Bumper Sticker assighnment
42(ADD)The NITROGEN Problem: Why Global Warming is Making it Worse (August 7, 2017)
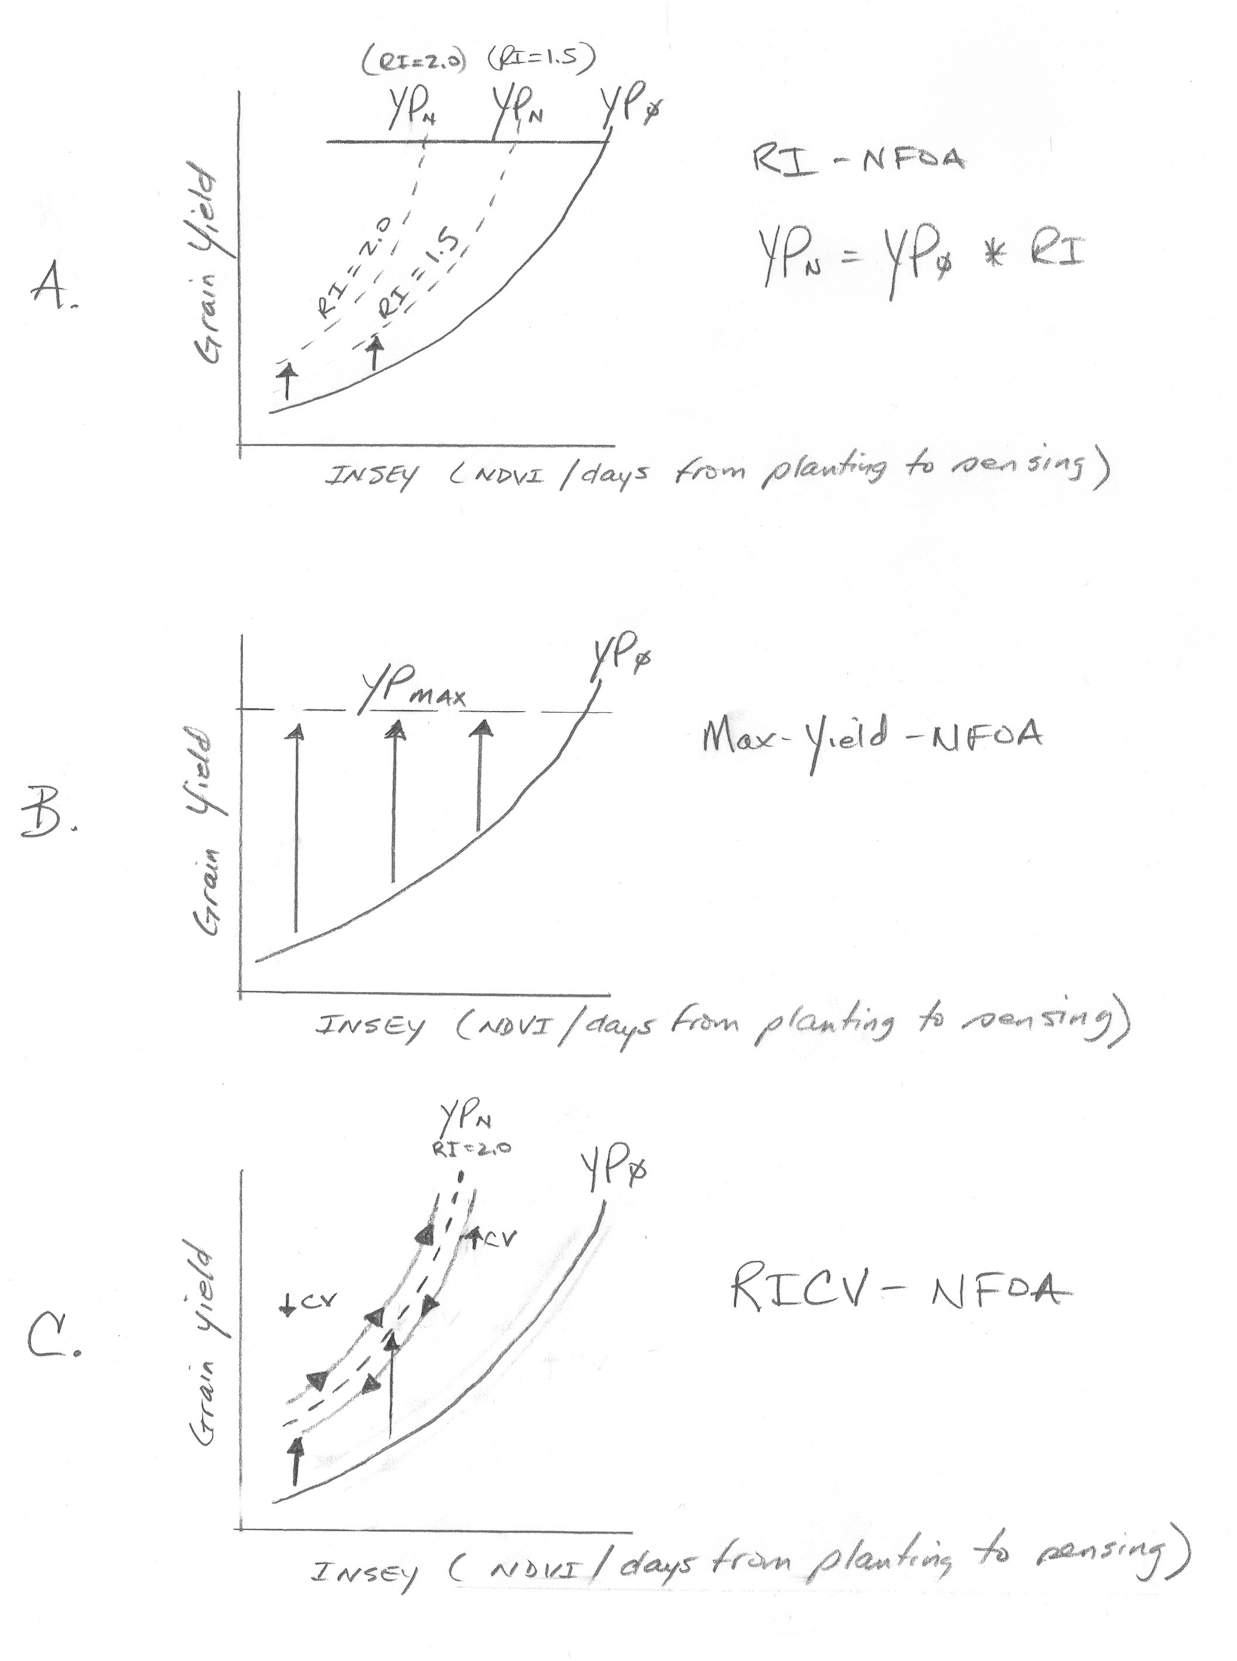
42. YP0-RI_2: Relationship between Grain Crop Yield Potential and Nitrogen Response. Agron. J. 105:1335-1344.
43. YP0-RI_1: Independence of Yield Potential and Crop Nitrogen Response.
44. Nebraska Response to YP0-RI (Schepers, Holland, Precision Ag)
45. Dr. Bushong Review of 44
46. NITROGEN FERTILIZATION ALGORITHM (entire web page), PPT, 2003 (Nitrogen Fertilization Optimization Algorithm)
47. Economic and Agronomic Impacts of Varied Philosophies of Soil Testing, Olson et al. (1981)
48. EPA article, Vehicle CO2 emissions, GWP (global warming potential)
49. People dying due to hunger versus other causes (Graphic Example)
R0 (epidemiology)
SED and CV (Pie)
Raw Data (CV, NDVI, Exp. 222)
(https://online.okstate.edu/) clicking the link labeled "Course Evaluations (SSI) - Stillwater, Tulsa, & CHS Campuses" in the "Course Evaluations" box on the main page.
CONTEXT / Move to to Phosphorus
50. NUE, Missouri, Nitrogen efficiency in our N systems study fields . Who are we kidding?
51. PUE, Johnston (New approach for PUE) Rothamsted
World Nitrogen Use Efficiency in Cereal Crops, Raun, 33%
World Phosphorus Use Efficiency in Cereal Crops, Dhillon, 16%
World Potassium Use Efficiency in Cereal Crops, Dhillon, 19%
World Sulfur Use Efficiency in Cereal Crops, Aula, 18%
53. Cereal nitrogen use efficiency in Sub Saharan Africa. J. Plant Nutr. 32:2107-2122
What does this look like? Corn plants spaced 7 in (18cm) apart?
Drawing/Illustration)
Highlight distances (Figueiredo graph)
BRAY
A Nutrient Mobility
Concept of Soil Plant Relationships (Roger
H.
Bray,
Univ. of Illinois, 1953) Sufficiency
Fact Sheet 2225
ppm * 2 = Soil Test Index
Bray's Mobility
Concept (PPT) Graphic Example
Consolidating
sufficiency, yield prediction and nutrient mobility.
Nitrogen
Fertilization Optimization Algorithm NFOA (has
graphic example),
ALL These Concepts/Fundamental
Theory must be Internalized
By-plant corn excavations (bottom)
55. Soil Fertility and
Hunger in Africa, Sanchez, Science
Magazine. P Deficiency is widespread
56.
Sander et al. (1990) (Bands
improve residual P)
57. (P Web Page)
PHOSPHORUS
quote: yield directly
proportional to the amount of the deficient nutrient present and the
crop content of the nutrient
pdf
2225 (printable)
Sufficiency should only be used for
immobile nutrients.
Leap of faith coming from using
"sufficiency" in NE
Fertilizer costs 2 to 6 times more
Rock phosphate - alternative
56 b.
SALT
Rate, Mead NE, 1 year Study
58. Phosphorus Solubility, Maintenance versus Buildup versus Sufficiency
Horizontal Bands
Dual Placement
Starter P Fertilizer
Phosphorus Solubility
Broadcast Preplant versus Banded P
Maintenance versus Sufficiency (Roger Bray)
(#57)
Buildup versus Maintenance
Nebraska MEAD Study. R.A. Olson
Confirmation of the Nutrient Mobility Concept (1962)
Phosphorus Question? P + Urea + CaSO4 (Document)
----------------------------------------------------------------------------------
----------------------------------------------------------------------------------
59.
Sensor
Results, Mexico
Nitrogen Uptake in Corn and Wheat (Al-Kaisi)
 Univ. Illinois, N Rate
Nitrogen Uptake Exercise (Board Example)
N Uptake Excel File (estimated N loss, Kanampiu)
Sulochana Dhital, Variable N Rates
----------------------------------------------------

Transportation costs associated with lower P analysis?
60.
Population 9 Billion
61.
YP0-RI versus Sufficiency
----------------------------------------------------
RI_CV excel sheet (sensitivity analysis, alter inputs)
WORLD NUE
Compute World NUE for 2017:
Economics, page on NUE web
site (What is this worth?)
Methods
to Determine NUE, Currently Invited by ASA, 2020
15N, pages
43 and 44 in Class BOOK, Update 2015
http://www.fao.org/faostat/en/#home
FAO STAT
---------------------------------------------------------------
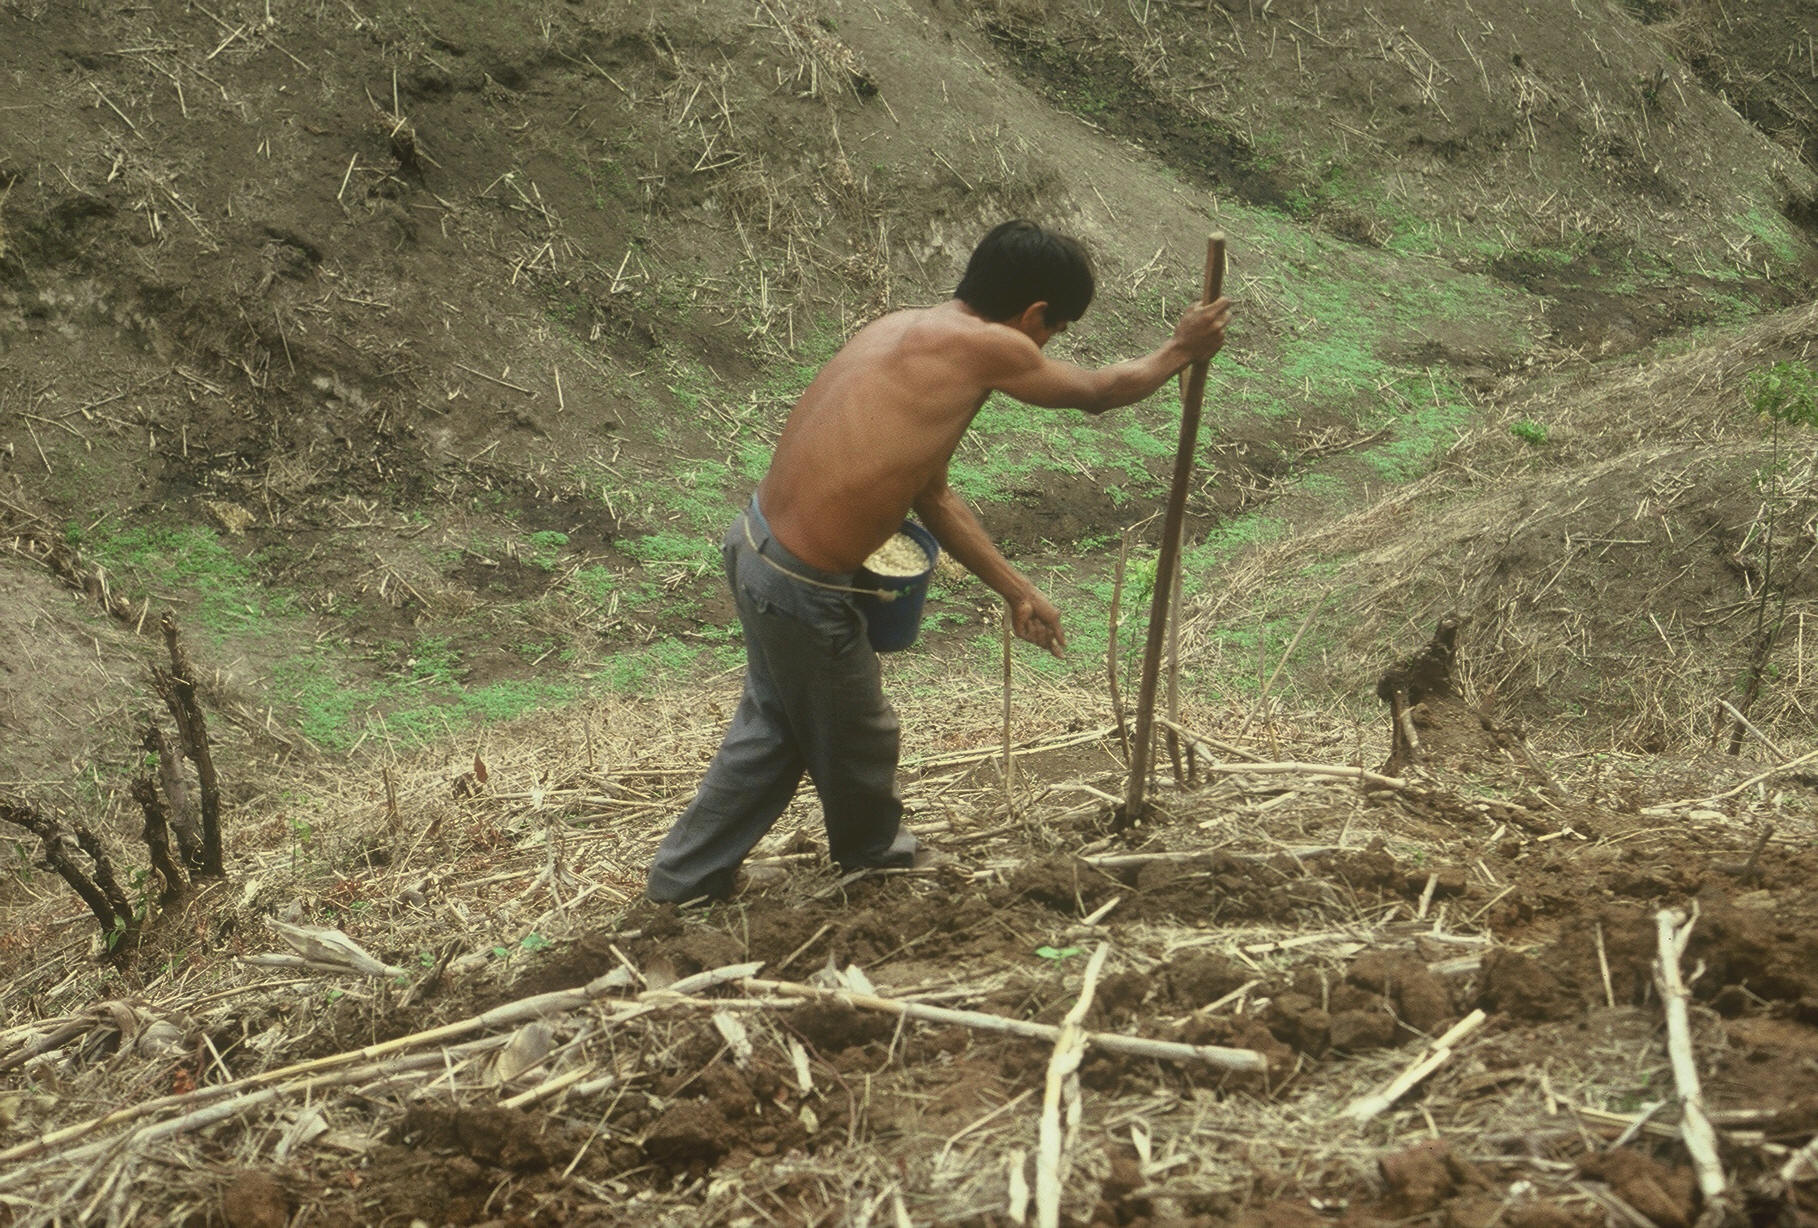
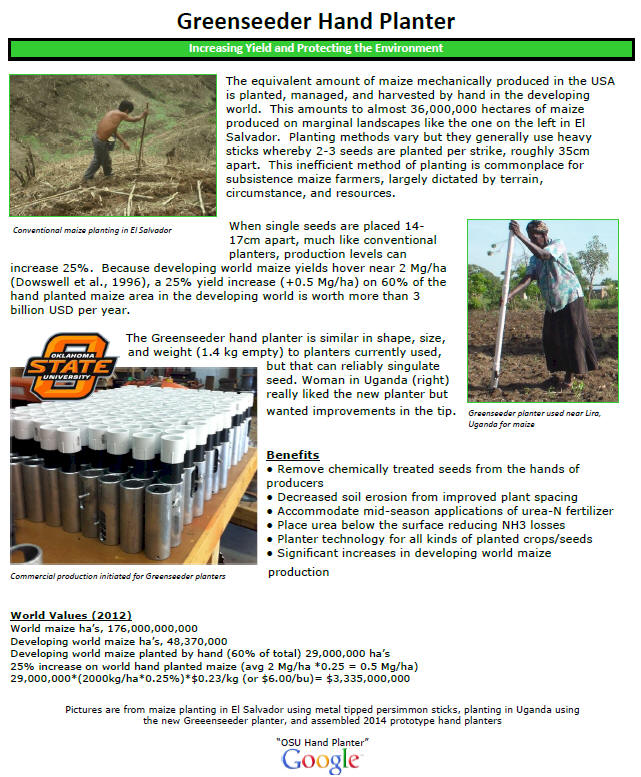
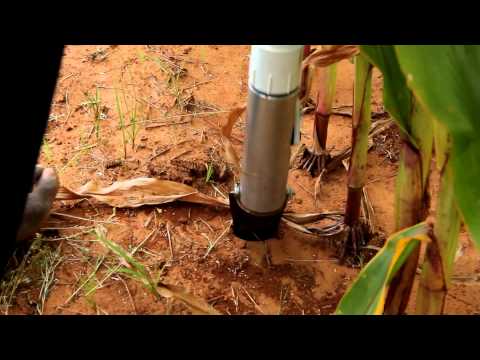
OSU Hand Planter, 1 - Minute Video
Why
are YP0 and RI Independent? Random nature of Environment
(AJ paper 2nd Law)
PPT File, ASA Presentation
----------------------------------
CLASS Supplemental Materials
Effect of long-term N fertilization on soil organic C and total N in
continuous wheat under conventional tillage in Oklahoma
Have we told the entire story? Benefits of Excess N?
Benefits of higher CO2?
Influence of
conservation tillage on soil properties. 1983. R.L.Blevins.
(Harvest Index at high N)
Nitrous Oxide
Emissions from Continuous Winter Wheat in the Southern Great Plains.
(Dr. Jason Warren, Dr. Jeremiah Mullock)
 From E.N. Ascencio thesis
XX
Effect of long-term fertilization on soil organic C
and total N in continuous wheat under conventional tillage in Oklahoma.
(Soil Tillage Res. 47:323-330).
XX
Evidence of dependence between crop vigor and yield. Prec. Agric.
13:276-284.(unreliability of yield,
Schepers)
XX
Equations for Estimating the Amount of Nitrogen Mineralized from Crop
Residues. 1991. SSSAJ,55:757 (Lignin
to N ratio)
SS Myth of Nitrogen
Fertilization for Soil Carbon Sequestration (N fertilizers
decrease soil organic) C. Mulvaney, Univ. Illinois. (move to rotations)
XX JEQ Article, Khan and
Mulvaney (curent N practices, exacerbate
soil C loss)
XX
High N rates can increase soil organic C,
Soil and Tillage Research.
100.
Corn Yield Response to Nitrogen Rate
and Timing in Sandy Irrigated Soils. 2005. Agron. J. 97:1230-1238.
(Last sentence, N warning), importance of knowing what the Yield is
101.
Post-anthesis nitrogen loss from corn. Agron. J. 85:659-663.
102.
Increased
plant N loss with increasing nitrogen applied in winter wheat observed
with 15N.
J. Plant Nutr. 23:219-230. (pdf)
103.
Effect of nitrogen rate on plant nitrogen loss in winter wheat varieties. J.
of Plant Nutr. 20 (2&3):389-404.
REVIEW (CO2)
Global Warming
18. Phillips.
Seasonal
and long-term changes in nitrate-nitrogen content of well water in
Oklahoma. 1997. J. Environmental Quality, 26:1632-1637.
19. Westerman, NH4 and NO3 Accumulation
20. Concepts and Rationale for Regional Nitrogen Rate Guidelines for Corn (Sawyer, Nafziger, Randall, Bundy, Rehm, Joern)Freeze mitigation (see entire page, new research)
Soil Plant Inorganic N Buffering, 1995
APRIL 17, 2020 ---
GMO's
-------------------------------
27. GM crops, world statistics, CLIVE JAMES
28. Consumers afraid of Biotech?
29. Why people oppose GMO's even though Science says they are safe (Scientific American) read last paragraph
30. Cheerios USA Today
"I have heard it said that the average person is lucky to have only a handful of true friends in their lifetime. Well, I sincerely feel I've got millions. John Wooden once told me "I would rather believe in people and be disappointed some of the time than never believe and be disapppointed all of the time." JN
-------------------------------------------------------
-------------------------------------------------------
-------------------------------------------------------
READING
_________________________________________________
____________________________________________
1. Becoming a Nitrogen Cycle Ninja (Bloomington, IL, Feb 3, 2015)
2. Nitrogen Cycle Ninja (Manuscript)
3-4. Equations for Estimating the Amount of Nitrogen Mineralized from Crop Residues Vigil and Kissel, 1991
5. Independence of YP0 and RI
6. Independence of YPO and RI2
(reviewer response 1) If you are doing something important you will find resistance
(reviewer response 2)
6B. Why are YP0 and RI independent?
7. Improving Nitrogen Use Efficiency, 1999, AJ
(excel file 2010)
8. Global Population and Nitrogen Cycle (V. Smil)
HOMEWORK 1
9. Bray Mobility Concept (A Nutrient Mobility Concept of Soil-Palnt Relationships)
10. Investment in By-Plant Technology "every plant counts"
Presentation, November 5, 2012, Dr. Bobby Stewart
(slides 69 and 81)
TOOLS:
IPNI Crop Nutrient Deficiency Image Collection
2 lbs N/bu of wheat (recommendation)
Yield Trends are Insufficient to Double Global Production
Feeding our
World (link)
Article
on Kernza, Univ. Minnesota
LIMUS Nitrogen Management, BASF
(improved NUE for Urea, UAN)
BAE Article, Dr. Borlaug
First
Hour Exam 2004
Second Hour Exam 2002
FINAL
EXAM 2002, KEY
FINAL
EXAM 2004, KEY
FINAL Exam (example)
FINAL Exam 2014 (actual)
Proficiency Exam (for nutrient
Mgmt Students)

(see page 12, ASA Manuscript Preparation, protocol for references)
Compute the number of days from planting to sensing, where growth was possible (40°F Threshhold) for a planting date of October 1, 2019, Sensing Date of February 21, 2020 (Locations, 4-Payne County, Altus, Woodward)
Courtesy, Brent Ballagh

MISSION II